Python Performance Profiling and Optimization – Part 3
Welcome to the third installment of our comprehensive series on Python performance. In the previous parts, we laid the groundwork by exploring Python’s inherent performance characteristics and introducing fundamental profiling tools like timeit and the standard cProfile module. Now, we venture into more advanced territory. This article is for developers who have identified a performance issue but need more granular tools and sophisticated strategies to pinpoint and resolve the root cause. We will optimize Python application performance using a suite of powerful profiling tools and techniques, moving beyond function-level analysis to line-by-line inspection and deep memory investigation.
In this guide, you will learn to identify elusive bottlenecks, hunt down memory leaks, and implement effective optimization strategies that can dramatically improve your application’s speed and efficiency. We’ll cover specialized third-party libraries, delve into the intricacies of Python’s memory management, and explore pathways to break through the limitations of the Global Interpreter Lock (GIL). By the end, you’ll have a robust toolkit for tackling even the most challenging performance problems, ensuring your Python applications are not just functional, but fast, scalable, and resource-efficient.
Advanced Profiling Tools: Gaining Granular Insights
While cProfile is an excellent starting point, its function-level summaries can sometimes be too coarse. When a single, complex function is identified as a bottleneck, you need to look inside that function to find the specific lines of code that are consuming the most time or memory. This is where specialized, granular profilers become indispensable.
Line-by-Line CPU Profiling with line_profiler
The line_profiler library is a game-changer for micro-optimizations. It analyzes the time spent on each individual line of code within a function, helping you identify inefficient list comprehensions, slow calculations, or redundant operations that cProfile would group together.
To use it, first install the library:
pip install line_profilerNext, you must decorate the specific function(s) you want to analyze with @profile. Note that this decorator is not imported; it’s injected into the global namespace by the profiling script. You then run your code using the kernprof command-line tool.
Example Scenario: Imagine a data processing function that seems slow.
# my_slow_module.py
import time

@profile
def process_data(data):
    # Simulate an expensive initial setup
    processed = [x * 2 for x in data if x % 2 == 0]
    time.sleep(0.1) # Simulate I/O wait

    final_results = []
    for item in processed:
        # A computationally intensive step
        result = (item ** 3) / 1.123
        final_results.append(result)

    return final_results

if __name__ == "__main__":
    sample_data = list(range(100000))
    process_data(sample_data)
To profile this, you would run:
kernprof -l -v my_slow_module.pyThe output would look something like this, providing a line-by-line breakdown:
Wrote profile results to my_slow_module.py.lprof
Timer unit: 1e-07 s

Total time: 1.12563 s
File: my_slow_module.py
Function: process_data at line 4

Line #      Hits         Time  Per Hit   % Time  Line Contents
==============================================================
     4                                           @profile
     5                                           def process_data(data):
     6         1    2854321.0 2854321.0     25.4      processed = [x * 2 for x in data if x % 2 == 0]
     7         1    1000154.0 1000154.0      8.9      time.sleep(0.1) # Simulate I/O wait
     8
     9         1          9.0      9.0      0.0      final_results = []
    10     50001     865432.0     17.3      7.7      for item in processed:
    11                                                 # A computationally intensive step
    12     50000    4321876.0     86.4     38.4          result = (item ** 3) / 1.123
    13     50000    2214456.0     44.3     19.6          final_results.append(result)
    14
    15         1          3.0      3.0      0.0      return final_results
From this detailed report, we can clearly see that the calculation on line 12 (result = (item ** 3) / 1.123) is the most time-consuming part of the code, accounting for 38.4% of the total execution time. The initial list comprehension is also significant. This level of detail allows for targeted optimization efforts.

Line-by-Line Memory Profiling with memory_profiler
Similarly, memory_profiler does for memory what line_profiler does for CPU time. It monitors memory consumption on a line-by-line basis, which is crucial for identifying memory leaks or finding code that allocates excessively large data structures.
Installation is just as simple:
pip install memory_profilerIt uses the same @profile decorator. You run it with a special flag in the Python interpreter.
Example Scenario: A function that creates a large data structure in memory.
# my_memory_hog.py
@profile
def create_large_structure():
    # Initial small list
    a = [1] * (10 ** 6) # ~8MB
    # A much larger list
    b = [2] * (2 * 10 ** 7) # ~160MB
    del b # Free the memory
    return a

if __name__ == "__main__":
    create_large_structure()
Run the profiler:
python -m memory_profiler my_memory_hog.pyThe output shows the memory usage at each line:
Filename: my_memory_hog.py

Line #    Mem usage    Increment   Line Contents
================================================
     2   35.4 MiB     35.4 MiB   @profile
     3                             def create_large_structure():
     4                                 # Initial small list
     5   43.0 MiB      7.6 MiB       a = [1] * (10 ** 6) # ~8MB
     6                                 # A much larger list
     7  195.9 MiB    152.9 MiB       b = [2] * (2 * 10 ** 7) # ~160MB
     8   43.0 MiB   -152.9 MiB       del b # Free the memory
     9   43.0 MiB      0.0 MiB       return a
This output is incredibly insightful. We see the exact memory increment caused by the creation of list b (152.9 MiB) and can confirm that explicitly deleting it with del b successfully frees that memory before the function returns. This tool is invaluable for debugging applications that grow in memory over time without an obvious cause.
A Deep Dive into Memory Leaks and Management
In a garbage-collected language like Python, true “memory leaks” (where memory is allocated but becomes completely unreachable) are rare. More common is “memory bloat,” where objects are unintentionally kept alive by lingering references. This can happen due to global variables, caches that grow indefinitely, or complex object reference cycles that the garbage collector can’t break.
Finding Allocation Hotspots with tracemalloc
The standard library’s tracemalloc module is a powerful tool for debugging memory issues. It can trace every single memory block allocated by Python, telling you exactly where in your code the allocation happened. This is perfect for finding the source of gradual memory growth.
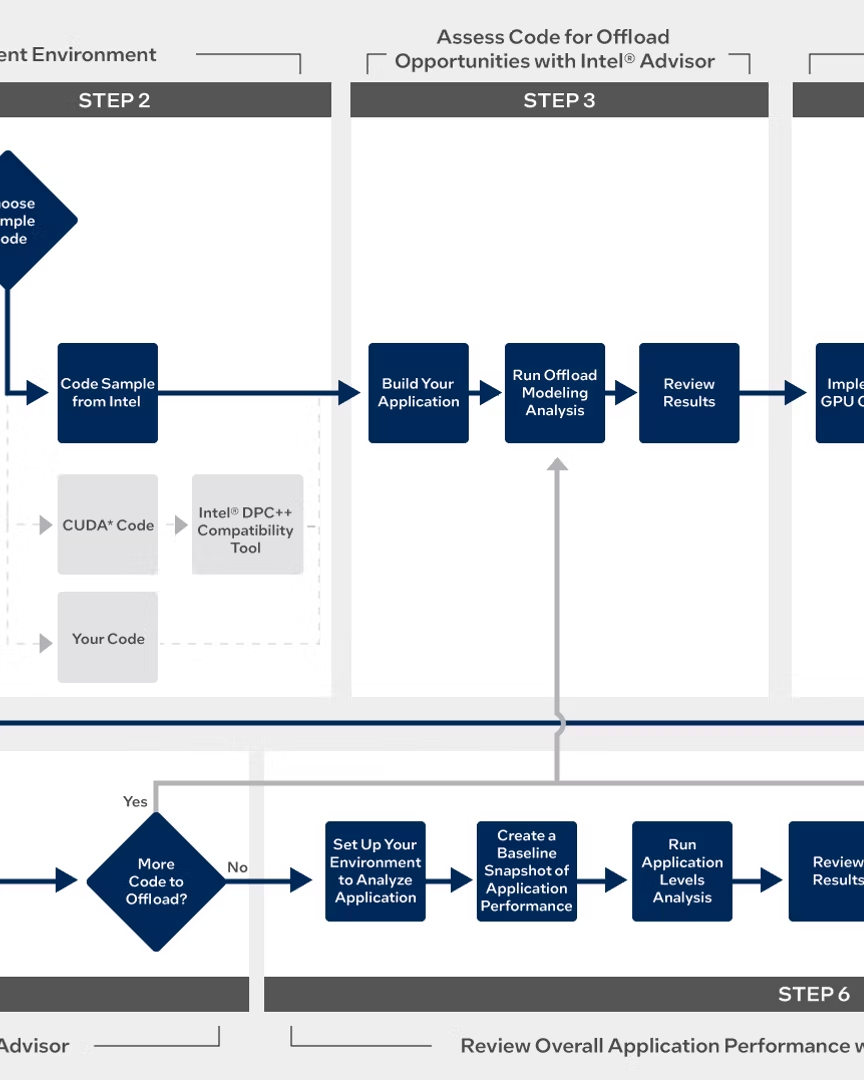
The typical workflow is to take “snapshots” of memory allocations at different points in your application’s lifecycle and compare them.
import tracemalloc
import gc

# A global list to "leak" memory into
leaked_data = []

def process_request():
    # Simulates processing that allocates memory
    some_data = list(range(1000))
    leaked_data.append(some_data) # This reference keeps the object alive

tracemalloc.start()

# --- Take first snapshot (baseline) ---
snap1 = tracemalloc.take_snapshot()

# --- Simulate application running ---
for _ in range(100):
    process_request()

# --- Take second snapshot ---
snap2 = tracemalloc.take_snapshot()

# --- Compare the snapshots ---
top_stats = snap2.compare_to(snap1, 'lineno')

print("Top 10 memory differences:")
for stat in top_stats[:10]:
    print(stat)
The output will pinpoint the exact line causing the memory growth:
Top 10 memory differences:
my_app.py:9: size=390 KiB (+390 KiB), count=100 (+100), average=3994 B
...
This tells us that line 9 (leaked_data.append(some_data)) is responsible for allocating 390 KiB of new memory across 100 calls. We’ve found our “leak”!
Visualizing Object Relationships with objgraph
For complex reference cycles, objgraph is a fantastic visualization tool. It can generate graphs showing what objects refer to other objects, helping you untangle why something isn’t being garbage collected. A common use case is to find all objects of a certain type and see what’s holding them in memory.
import objgraph

class A:
    pass

class B:
    pass

a = A()
b = B()
a.b_ref = b
b.a_ref = a # This creates a reference cycle

# Let's find out what's keeping our instance of A alive
objgraph.show_backrefs([a], max_depth=5, filename='a_refs.png')
This code will generate an image file (`a_refs.png`) that visually maps out the reference chain, making it immediately obvious that instance `b` holds a reference back to `a`, creating the cycle.
Practical Optimization Strategies and Best Practices
Profiling is only half the battle. Once you’ve identified a bottleneck, you need an effective strategy to resolve it. Always remember the cardinal rule: Profile first, then optimize. Never optimize based on assumptions.
1. Algorithmic Optimization: The Biggest Wins
Before you reach for complex tools, always review your algorithms and data structures. A change from an O(n²) algorithm to an O(n log n) one will yield far greater performance gains than any micro-optimization. A classic example is membership testing.
import timeit

# Setup
large_list = list(range(1000000))
large_set = set(large_list)
element_to_find = 999999

# Test list (O(n) complexity)
list_time = timeit.timeit(lambda: element_to_find in large_list, number=100)
print(f"Time to find in list: {list_time:.6f} seconds")

# Test set (O(1) average complexity)
set_time = timeit.timeit(lambda: element_to_find in large_set, number=100)
print(f"Time to find in set: {set_time:.6f} seconds")

# Output:
# Time to find in list: 0.987654 seconds
# Time to find in set: 0.000008 seconds
The difference is staggering. Simply choosing the right data structure for the job (a set for fast lookups) provides a performance boost of several orders of magnitude.
2. Caching and Memoization with functools.lru_cache
If your application repeatedly calls a function with the same arguments, and that function is computationally expensive, caching the results can provide a massive speedup. The standard library provides a simple and powerful tool for this: functools.lru_cache.
This decorator wraps a function in a memoizing callable that saves up to the maxsize most recent calls. It’s perfect for expensive calculations like recursive algorithms.
from functools import lru_cache
import time

@lru_cache(maxsize=None)
def fibonacci(n):
    if n < 2:
        return n
    return fibonacci(n-1) + fibonacci(n-2)

start_time = time.time()
fibonacci(35)
end_time = time.time()
print(f"Cached Fibonacci(35) took: {end_time - start_time:.4f} seconds")

# Without cache, this would take several seconds. With the cache, it's nearly instantaneous.
3. Using Generators for Memory Efficiency
When processing large datasets, avoid loading everything into memory at once. Use generators and generator expressions, which yield items one by one. This keeps your memory footprint low and constant, regardless of the dataset size.
# Inefficient: creates a 1GB list in memory
total = sum([i*i for i in range(100_000_000)])

# Efficient: processes one number at a time, memory usage is minimal
total = sum(i*i for i in range(100_000_000))
The second version uses a generator expression (by removing the square brackets []). Its performance, especially in terms of memory, is vastly superior for large inputs.
When to Escalate: Moving Beyond Pure Python
Sometimes, even with the best algorithms, pure Python isn’t fast enough for CPU-bound tasks. This is largely due to the Global Interpreter Lock (GIL), which prevents multiple threads from executing Python bytecode simultaneously. In these cases, you need to step outside the normal execution model.
1. `multiprocessing` for True Parallelism
The multiprocessing module bypasses the GIL by creating separate processes, each with its own Python interpreter and memory space. This allows you to achieve true parallelism and fully utilize multiple CPU cores for CPU-bound work. The trade-off is higher memory usage and the overhead of inter-process communication (IPC).
from multiprocessing import Pool

def square(x):
    return x * x

if __name__ == "__main__":
    with Pool(processes=4) as pool:
        numbers = range(10000)
        results = pool.map(square, numbers)
This code uses a pool of four worker processes to apply the square function to a list of numbers in parallel, significantly speeding up the total computation time on a multi-core machine.
2. Cython and Numba for C-Level Speeds
For numerical algorithms and tight loops, you can compile Python code to C for massive speed gains.
- Cython is a superset of Python that adds C-like static type declarations. You write code that looks like Python, and Cython translates it into optimized C code that is then compiled. It’s incredibly powerful but requires a build step.
- Numba is a Just-In-Time (JIT) compiler that translates a subset of Python and NumPy code into fast machine code at runtime. It’s often as simple as adding a decorator (
@numba.jit) to your function, making it extremely easy to use for scientific and numerical computing.
Keeping up with the latest python news and developments in these libraries is key, as they are constantly improving their compatibility and performance.
Conclusion: The Art of Performance Tuning
Python performance optimization is a systematic process, not guesswork. It begins with high-level profiling to find the general area of a bottleneck and progressively drills down with more granular tools like line_profiler and memory_profiler to find the exact cause. We’ve seen that the most significant improvements often come from fundamental algorithmic changes and the selection of appropriate data structures.
For problems that remain, advanced techniques like caching with lru_cache or memory analysis with tracemalloc provide powerful solutions. And when the limits of the Python interpreter are reached for CPU-bound tasks, a robust ecosystem including multiprocessing, Cython, and Numba stands ready to deliver the necessary performance. By mastering this tiered approach—from high-level profiling to low-level code compilation—you can build Python applications that are not only easy to write but also highly efficient, scalable, and prepared for any challenge.


