Building Next-Generation News Applications with Python: From LLM Extraction to Interactive Dashboards
The way we consume and interact with news is undergoing a profound transformation. Static articles and simple feeds are being replaced by dynamic, data-driven experiences that offer deeper insights and context. For developers, this shift presents a massive opportunity. Python, with its rich ecosystem of libraries for data science, machine learning, and web development, stands at the forefront of this revolution. Modern python news development is no longer just about scraping headlines; it’s about building intelligent systems that can understand, analyze, and visualize the torrent of information shaping our world.

In this comprehensive guide, we will explore the end-to-end process of creating a sophisticated news analysis application. We’ll start by leveraging the power of Large Language Models (LLMs) like Google’s Gemini to extract structured, actionable data from unstructured news text. We’ll then move on to aggregating this data and, finally, build a stunningly interactive dashboard using Dash and Plotly to turn raw information into compelling visual insights. This article will provide practical code, discuss best practices, and equip you with the knowledge to build your own advanced news intelligence platforms.
Section 1: The New Foundation – Extracting Structured Data with LLMs
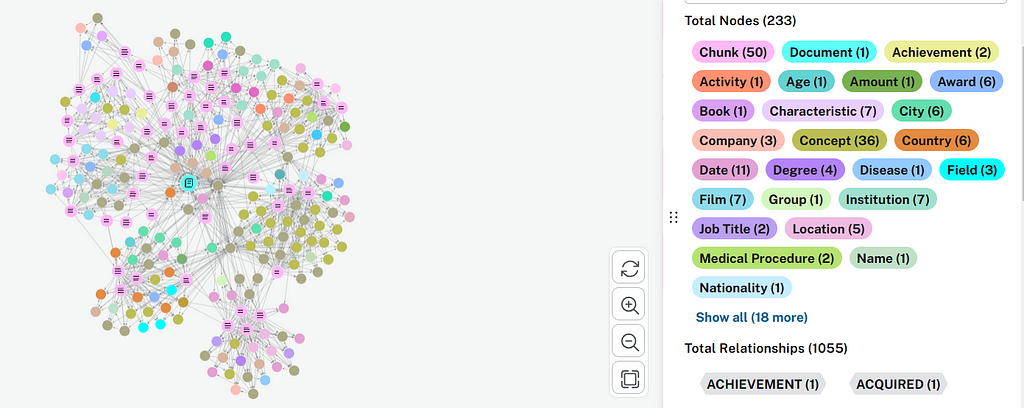
The first and most crucial step in any modern news analysis pipeline is data extraction. A raw news article is a block of unstructured text, making it difficult for machines to analyze. The goal is to transform this text into a structured format, like JSON, that identifies key entities, summarizes the content, and even gauges sentiment. This is where LLMs have become a game-changer.
Why LLMs are a Paradigm Shift for News Analysis
Traditionally, this task required complex Natural Language Processing (NLP) pipelines involving named-entity recognition (NER), sentiment analysis models, and summarization algorithms, each requiring separate training and maintenance. Today, a single API call to a powerful LLM can accomplish all of this with remarkable accuracy. Tools inspired by concepts like Google’s LangExtract abstract this complexity, allowing developers to define a desired data schema and let the model handle the extraction.
Let’s consider a fictional news update from our timeline: “As of September 2025, Neo X MainNet now includes an advanced Anti-MEV system to prevent unfair trading practices, a move praised by the decentralized finance community. Concurrently, the Mamba SDK v3.0 launched with enhanced developer tools for building on the new architecture.”
Our goal is to turn this text into a clean, structured dictionary.
Practical Example: Structuring News with Python and Gemini
We can use the `google-generativeai` library to interact with the Gemini API. By crafting a specific prompt, we can instruct the model to return a JSON object with the exact fields we need.
import google.generativeai as genai
import json
import os

# Configure the API key (store it as an environment variable)
# from google.colab import userdata
# GOOGLE_API_KEY=userdata.get('GOOGLE_API_KEY')
# genai.configure(api_key=GOOGLE_API_KEY)

# For local development, you might use:
# genai.configure(api_key=os.environ["GOOGLE_API_KEY"])

# Note: For this example to run, you must have a configured API key.
# We will simulate the model's output for demonstration purposes if no key is present.

def extract_structured_data_from_news(article_text: str) -> dict:
    """
    Uses a generative AI model to extract structured data from a news article.

    Args:
        article_text: The raw text of the news article.

    Returns:
        A dictionary containing the structured data.
    """
    # This is a simplified example. In production, you would use a more robust
    # library like Pydantic to define and validate the output schema.
    prompt = f"""
    Analyze the following news article and extract the key information as a JSON object.
    The JSON object must have the following keys:
    - "summary": A concise, one-sentence summary of the main event.
    - "entities": A list of key entities (organizations, products, technologies). Each entity should be an object with "name" and "type" (e.g., "Organization", "Technology", "Product").
    - "sentiment": The overall sentiment of the article (e.g., "Positive", "Neutral", "Negative").
    - "event_date": The date mentioned in the article, if any, in YYYY-MM-DD format. Use "null" if not present.

    Article Text:
    ---
    {article_text}
    ---

    JSON Output:
    """

    try:
        # This is where the actual API call would be made
        # model = genai.GenerativeModel('gemini-pro')
        # response = model.generate_content(prompt)
        # result_text = response.text.strip().replace("```json", "").replace("```", "")
        # return json.loads(result_text)

        # --- SIMULATED RESPONSE FOR DEMONSTRATION ---
        # In a real scenario, the LLM would generate this JSON.
        print("Note: Using simulated LLM response. Configure API key for live results.")
        simulated_json_output = {
            "summary": "Neo X MainNet has integrated an Anti-MEV system and Mamba SDK v3.0 has been launched to support the new architecture.",
            "entities": [
                {"name": "Neo X MainNet", "type": "Technology"},
                {"name": "Anti-MEV system", "type": "Technology"},
                {"name": "Mamba SDK v3.0", "type": "Product"}
            ],
            "sentiment": "Positive",
            "event_date": "2025-09-01" # Assuming the month from the context
        }
        return simulated_json_output

    except Exception as e:
        print(f"An error occurred: {e}")
        return {"error": "Failed to process article."}

# Example Usage
news_snippet = "As of September 2025, Neo X MainNet now includes an advanced Anti-MEV system to prevent unfair trading practices, a move praised by the decentralized finance community. Concurrently, the Mamba SDK v3.0 launched with enhanced developer tools for building on the new architecture."

structured_news = extract_structured_data_from_news(news_snippet)
print(json.dumps(structured_news, indent=2))
This function provides a reusable and powerful way to preprocess any news article, forming the bedrock of our application.
Section 2: Building a News Aggregation Pipeline
With a reliable method for processing individual articles, the next step is to build a pipeline that can fetch news from multiple sources, process them in a scalable way, and store the structured results for analysis. This involves fetching data from APIs or RSS feeds and orchestrating our extraction function.
Choosing Your Data Sources
Real-world applications often pull data from various sources:
- RSS Feeds: A classic and still highly effective way to get headlines and summaries from blogs and news sites.
- News APIs: Services like NewsAPI, GNews, or specialized financial data providers offer more structured data but often come with costs and rate limits.
- Web Scraping: Directly scraping websites (while respecting
robots.txtand terms of service) can provide data from sources without official APIs. Libraries likeBeautifulSoupandScrapyare essential here.
Example: Aggregating from RSS Feeds
For our example, we’ll use the feedparser library to fetch data from a few tech news RSS feeds. We will then iterate through the entries and use our extract_structured_data_from_news function from the previous section to process each one.
import feedparser
import json
# We will reuse the extraction function from the previous example
# from llm_extractor import extract_structured_data_from_news

# --- Re-defining the function here for a self-contained example ---
def extract_structured_data_from_news(article_text: str) -> dict:
    """Simulated LLM extraction function."""
    print(f"Processing article: '{article_text[:50]}...'")
    # In a real app, this would make an API call. We simulate it for speed.
    # The quality of the output would depend on the article's content.
    if "Neo X" in article_text:
        return {
            "summary": "Neo X MainNet has integrated an Anti-MEV system and Mamba SDK v3.0 has been launched.",
            "entities": [{"name": "Neo X MainNet", "type": "Technology"}, {"name": "Mamba SDK v3.0", "type": "Product"}],
            "sentiment": "Positive", "event_date": "2025-09-01"
        }
    elif "Google" in article_text:
         return {
            "summary": "Google has open-sourced LangExtract, a Python library for turning unstructured text into structured data using LLMs like Gemini.",
            "entities": [{"name": "Google", "type": "Organization"}, {"name": "LangExtract", "type": "Product"}, {"name": "Gemini", "type": "Product"}],
            "sentiment": "Positive", "event_date": None
        }
    else:
        return {"summary": "General news update.", "entities": [], "sentiment": "Neutral", "event_date": None}

def aggregate_news_from_rss(rss_feeds: list) -> list:
    """
    Fetches news from a list of RSS feeds and processes each article.

    Args:
        rss_feeds: A list of URLs for RSS feeds.

    Returns:
        A list of dictionaries, where each dictionary is the structured
        data for one news article.
    """
    all_structured_news = []

    for feed_url in rss_feeds:
        print(f"\nFetching news from: {feed_url}")
        feed = feedparser.parse(feed_url)

        # We'll process a limited number of entries to keep the example quick
        for entry in feed.entries[:2]:
            article_title = entry.title
            # Use summary if available, otherwise description
            article_content = entry.get('summary', entry.get('description', ''))

            # Combine title and content for better context for the LLM
            full_text = f"{article_title}. {article_content}"

            structured_data = extract_structured_data_from_news(full_text)

            # Add original source information for traceability
            structured_data['source_url'] = entry.link
            structured_data['original_title'] = article_title

            all_structured_news.append(structured_data)

    return all_structured_news

# Example Usage with placeholder RSS feeds
# Replace these with real RSS feed URLs
# Note: These URLs are illustrative and may not be active.
tech_rss_feeds = [
    "http://feeds.arstechnica.com/arstechnica/index", # Example real feed
    "https://www.theverge.com/rss/index.xml" # Example real feed
]

# For this example, let's create mock feed data to ensure it runs
# In a real run, you would remove this and use the live fetch
mock_entry_1 = {"title": "Neo X MainNet Update", "summary": "As of September 2025, Neo X MainNet now includes an advanced Anti-MEV system...", "link": "http://example.com/neo"}
mock_entry_2 = {"title": "Google's New Tool", "summary": "Google just made turning unstructured text into structured, actionable #Data much easier with LangExtract.", "link": "http://example.com/google"}
feedparser.parse = lambda url: {"entries": [mock_entry_1, mock_entry_2]}

processed_news = aggregate_news_from_rss(["http://mock.feed/1"])
print("\n--- Aggregated and Processed News ---")
print(json.dumps(processed_news, indent=2))
This script now gives us a list of structured Python dictionaries. The next logical step is to persist this data. For development, saving to a CSV or JSON file is fine. In production, you would insert this data into a database like PostgreSQL or a data warehouse like BigQuery for robust querying and analysis.
Section 3: Visualizing Insights with Dash and Plotly
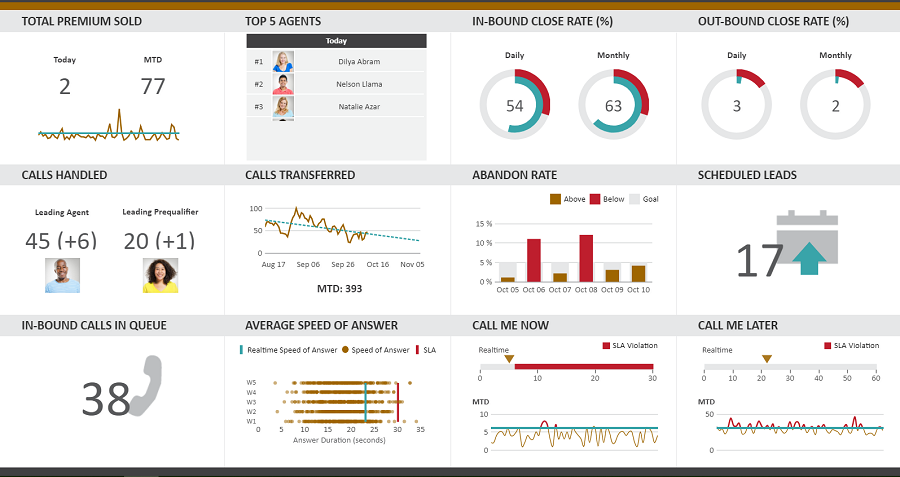
Raw JSON data is for machines. To make it useful for humans, we need to visualize it. This is where we can turn our static data into a dynamic, interactive dashboard. Dash, built on top of Flask and React.js, allows you to build powerful analytical web applications using only Python. It integrates seamlessly with Plotly, a declarative charting library, to create beautiful, interactive visualizations.
Core Concepts of a Dash Application
A Dash app consists of two main parts:
- Layout: The “what.” This defines the structure and appearance of your application using components like graphs, dropdowns, sliders, and text blocks. It’s like the HTML of your app.
- Callbacks: The “how.” These are Python functions that are automatically called whenever an input component’s property changes (e.g., a user selects a new value from a dropdown). The function performs a calculation and updates the property of an output component (e.g., the data in a graph).
Example: An Interactive News Sentiment Dashboard
Let’s build a simple dashboard that displays our processed news. It will feature a dropdown to filter news by entity (e.g., “Neo X MainNet”, “Google”) and a bar chart showing the sentiment distribution for the selected entity. We’ll use pandas to manage our data.
import dash
from dash import dcc, html, Input, Output
import plotly.express as px
import pandas as pd

# --- Sample Data ---
# In a real application, you would load this from your database or a file.
# We'll use the data structure from our previous aggregation step.
sample_data = [
    {
        "summary": "Neo X MainNet has integrated an Anti-MEV system...",
        "entities": [{"name": "Neo X MainNet", "type": "Technology"}, {"name": "Mamba SDK v3.0", "type": "Product"}],
        "sentiment": "Positive",
        "source_url": "http://example.com/neo",
        "original_title": "Neo X MainNet Update"
    },
    {
        "summary": "Google has open-sourced LangExtract...",
        "entities": [{"name": "Google", "type": "Organization"}, {"name": "LangExtract", "type": "Product"}],
        "sentiment": "Positive",
        "source_url": "http://example.com/google",
        "original_title": "Google's New Tool"
    },
    {
        "summary": "Market remains stable despite new regulations.",
        "entities": [{"name": "Market", "type": "Concept"}],
        "sentiment": "Neutral",
        "source_url": "http://example.com/market",
        "original_title": "Market Watch"
    },
    {
        "summary": "Legacy system faces security vulnerability.",
        "entities": [{"name": "Legacy System", "type": "Technology"}],
        "sentiment": "Negative",
        "source_url": "http://example.com/security",
        "original_title": "Security Alert"
    }
]

# Pre-process the data: "explode" the entities list so each entity has its own row.
# This makes filtering and aggregation much easier.
records = []
for item in sample_data:
    if item['entities']:
        for entity in item['entities']:
            records.append({
                'entity_name': entity['name'],
                'sentiment': item['sentiment'],
                'title': item['original_title'],
                'url': item['source_url']
            })
    else: # Handle articles with no entities
         records.append({
                'entity_name': 'Uncategorized',
                'sentiment': item['sentiment'],
                'title': item['original_title'],
                'url': item['source_url']
            })

df = pd.DataFrame(records)

# Get a unique list of entities for our dropdown
all_entities = df['entity_name'].unique()

# Initialize the Dash app
app = dash.Dash(__name__)

# Define the app layout
app.layout = html.Div(children=[
    html.H1(children='Python News Analysis Dashboard'),

    html.Div(children='''
        Select an entity to analyze its news sentiment.
    '''),

    dcc.Dropdown(
        id='entity-dropdown',
        options=[{'label': i, 'value': i} for i in all_entities],
        value=all_entities[0] # Default value
    ),

    dcc.Graph(
        id='sentiment-bar-chart'
    )
])

# Define the callback to update the graph
@app.callback(
    Output('sentiment-bar-chart', 'figure'),
    Input('entity-dropdown', 'value')
)
def update_graph(selected_entity):
    if not selected_entity:
        return dash.no_update

    # Filter the DataFrame based on the dropdown selection
    filtered_df = df[df.entity_name == selected_entity]

    # Count the occurrences of each sentiment
    sentiment_counts = filtered_df['sentiment'].value_counts().reset_index()
    sentiment_counts.columns = ['sentiment', 'count']

    # Create the bar chart
    fig = px.bar(
        sentiment_counts,
        x='sentiment',
        y='count',
        title=f'Sentiment Analysis for: {selected_entity}',
        labels={'count': 'Number of Articles', 'sentiment': 'Sentiment'},
        color='sentiment',
        color_discrete_map={
            'Positive': 'green',
            'Neutral': 'grey',
            'Negative': 'red'
        }
    )

    return fig

# Run the app
if __name__ == '__main__':
    # To run this, you'll need to install dash, pandas, and plotly
    # pip install dash pandas plotly
    app.run_server(debug=True)
When you run this Python script, it will start a local web server. Navigating to the provided address (usually http://127.0.0.1:8050/) in your browser will display your interactive dashboard. Changing the dropdown value will instantly re-render the chart, providing a dynamic way to explore the news data.
Section 4: Best Practices, Optimization, and Pitfalls
Building a robust python news application requires more than just functional code. You need to consider performance, cost, and reliability.
Performance and Cost Optimization
- Caching LLM Results: LLM API calls can be slow and expensive. Implement a caching layer (using Redis or even a simple dictionary/database table) to store the results for a given article text. Before calling the API, check if you’ve already processed that exact text.
- Asynchronous Data Fetching: When fetching from many RSS feeds or APIs, doing so sequentially is a bottleneck. Use libraries like
asyncioandaiohttpto make network requests concurrently, drastically reducing your data aggregation time. - Database Indexing: As your dataset grows, querying it can become slow. Ensure that columns you frequently filter on (like
entity_nameorevent_date) are indexed in your database. - Dashboard Performance: For dashboards with computationally expensive callbacks, use Dash’s background callbacks (
@callback(..., background=True)) to prevent the UI from freezing while the server processes the request.
Common Pitfalls and How to Avoid Them
- LLM Hallucinations and Inconsistency: LLMs can sometimes “hallucinate” or invent facts, or their JSON output might not be perfectly formatted.
Solution: Use prompt engineering to be very specific about the output format. Use a lower “temperature” setting in the API call for more deterministic outputs. Always include atry-exceptblock around your JSON parsing to handle malformed responses gracefully. - API Rate Limiting: Most APIs and websites will block your IP if you make too many requests in a short period.
Solution: Always check the API’s rate limit policy. Implement a delay (e.g.,time.sleep(1)) between requests and use an exponential backoff strategy for retries if you get a rate limit error (status code 429). - Data Normalization: The same entity might be referred to in different ways (e.g., “Google”, “Alphabet Inc.”, “GOOGL”).
Solution: This is a complex problem known as entity resolution. A simple approach is to create a mapping of aliases to a canonical entity name. More advanced solutions involve using vector embeddings to find semantically similar entities.
Conclusion: The Future of News is Programmatic
We’ve journeyed through the entire lifecycle of a modern python news application—from transforming raw, unstructured text into valuable, structured data with LLMs, to aggregating it into a coherent dataset, and finally, to visualizing it through an interactive web dashboard. This workflow demonstrates the immense power and flexibility of the Python ecosystem. By combining the natural language understanding of models like Gemini with the analytical and visualization prowess of libraries like Pandas, Dash, and Plotly, developers can now build tools that were once the exclusive domain of large financial institutions and media companies.
The key takeaway is that the barrier to entry for creating sophisticated information intelligence systems has never been lower. As a next step, consider expanding this project: deploy your Dash application to a cloud service like Heroku or AWS, set up your aggregation script to run on a schedule as a cron job, or explore more advanced NLP techniques like topic modeling to discover hidden trends in your news data over time. The future of news consumption is interactive, data-rich, and built with code—and Python provides the perfect toolkit to lead the way.
