Python Performance Profiling and Optimization
In the world of software development, Python is celebrated for its simplicity, readability, and rapid development cycle. However, this high-level abstraction can sometimes come at the cost of raw performance. When an application starts to feel sluggish, or server costs begin to climb, developers are faced with a critical task: optimization. But optimization without data is merely guesswork. This is where performance profiling becomes an indispensable skill. It transforms the art of improving code into a science, allowing you to pinpoint exact bottlenecks, understand resource consumption, and make targeted, effective changes. This comprehensive guide will walk you through the entire lifecycle of Python performance tuning, from understanding the philosophy behind it to mastering the tools and techniques that turn slow code into a high-performance asset. We will explore how to identify CPU-bound and I/O-bound issues, hunt down memory leaks, and implement proven strategies to make your Python applications faster, more efficient, and more scalable.
Why Performance Profiling is Non-Negotiable
Before diving into the “how” of optimization, it’s crucial to understand the “why” and “when.” Acting on intuition alone often leads to wasted effort and more complex, unreadable code with negligible performance gains. A methodical, data-driven approach is always superior.
The Perils of Premature Optimization
Computer scientist Donald Knuth famously stated, “Premature optimization is the root of all evil.” This principle is a cornerstone of effective software engineering. It cautions against optimizing code before it’s proven to be a bottleneck. The risks of optimizing too early include:
- Wasted Development Time: You might spend hours or days optimizing a piece of code that only accounts for 1% of the total execution time.
- Increased Code Complexity: Optimized code is often less readable and harder to maintain than its straightforward counterpart. Sacrificing clarity for a performance gain that doesn’t matter is a poor trade-off.
- Introducing Bugs: Complex optimizations can introduce subtle bugs that are difficult to track down.
The correct approach is to write clean, clear, and correct code first. Once the application is functional, you can then use profiling tools to identify the specific areas that are causing performance issues.
Establishing a Performance Baseline
You cannot improve what you do not measure. The first step in any optimization process is to establish a baseline. This means running your code under realistic conditions and measuring its performance. This baseline serves as a benchmark against which you can compare all future changes. To create a reliable baseline, you should:
- Use a Consistent Environment: Run your tests on the same hardware with the same software configuration to ensure your results are comparable.
- Use Representative Data: Test with data that mirrors what your application will handle in a production environment.
- Measure Multiple Times: Run the code several times and take an average to account for minor fluctuations in system performance.
Tools like Python’s built-in timeit module are excellent for micro-benchmarking small snippets of code and establishing a precise baseline for specific functions.
Identifying the Real Bottlenecks: The 80/20 Rule
The Pareto principle, or the 80/20 rule, often applies to software performance: 80% of the execution time is spent in just 20% of the code. The primary goal of profiling is to find that critical 20%. These performance “hotspots” are where your optimization efforts will yield the most significant returns. A profiler analyzes your code as it runs, collecting data on how long each function takes and how many times it’s called. This data allows you to move from guessing where the slowdown is to knowing with certainty.
A Deep Dive into Python’s Profiling Tools
Python comes with a rich ecosystem of tools designed to help you analyze and understand your code’s performance. Mastering these tools is the key to effective optimization.
The Built-in Profilers: cProfile and pstats
Python’s standard library includes two primary profilers: profile and cProfile. While profile is a pure Python implementation, cProfile is a C-extension with much lower overhead, making it the recommended choice for most use cases. It provides a statistical analysis of your program’s execution, detailing function calls, execution times, and more.
Let’s consider a simple, computationally intensive function to see cProfile in action.
# slow_script.py
import time

def slow_function():
    """A function that simulates a CPU-intensive task."""
    result = 0
    for i in range(10**7):
        result += i
    return result

def fast_function():
    """A function that does something quickly."""
    time.sleep(0.1)
    return "done"

def main():
    slow_function()
    fast_function()

if __name__ == "__main__":
    main()
You can run cProfile directly from the command line:
python -m cProfile -s cumulative slow_script.py
The -s cumulative flag sorts the output by cumulative time spent in each function. The output will look something like this:
         5 function calls in 0.453 seconds

   Ordered by: cumulative time

   ncalls  tottime  percall  cumtime  percall filename:lineno(function)
        1    0.000    0.000    0.453    0.453 {built-in method builtins.exec}
        1    0.000    0.000    0.453    0.453 slow_script.py:1(<module>)
        1    0.000    0.000    0.453    0.453 slow_script.py:15(main)
        1    0.352    0.352    0.352    0.352 slow_script.py:4(slow_function)
        1    0.101    0.101    0.101    0.101 {built-in method time.sleep}
Here’s a breakdown of the columns:
- ncalls: The number of times the function was called.
- tottime: The total time spent in the function itself (excluding calls to sub-functions).
- percall:
tottimedivided byncalls. - cumtime: The cumulative time spent in this function plus all sub-functions. This is the most useful metric for identifying bottlenecks.
- percall:
cumtimedivided byncalls.
From this output, we can clearly see that slow_function is our primary bottleneck, with a cumtime of 0.352 seconds.
Visualizing Profiling Data with snakeviz
While the text output from cProfile is useful, it can be difficult to interpret for complex applications. Visual tools like snakeviz can make the analysis much more intuitive. It renders the profiler output as an interactive flame graph.
First, save the profiler output to a file:
python -m cProfile -o profile.prof slow_script.py
Then, install and run snakeviz:

pip install snakeviz
snakeviz profile.prof
This will open a browser window with a chart where the width of each block represents the time spent in that function. It provides a clear, top-down view of your call stack, making it easy to spot the widest bars—your performance hotspots.
Line-by-Line Profiling with line_profiler
cProfile tells you *which functions* are slow, but what if you need to know *which lines within a function* are the problem? This is where line_profiler shines. It analyzes the execution time of each line of code inside a function.
After installing it (pip install line_profiler), you need to decorate the function you want to analyze with @profile.
# line_profiler_example.py
import requests

# The decorator is added by kernprof, no import needed
@profile
def get_data_from_apis():
    """Fetches data from multiple sources."""
    response1 = requests.get('https://httpbin.org/delay/1')
    data1 = response1.json()

    response2 = requests.get('https://httpbin.org/delay/2')
    data2 = response2.json()

    # Some processing
    combined_keys = list(data1.keys()) + list(data2.keys())
    print(f"Combined keys: {len(combined_keys)}")

if __name__ == "__main__":
    get_data_from_apis()
You run it using the kernprof command:
kernprof -l -v line_profiler_example.py
The output provides a detailed, line-by-line breakdown:
Timer unit: 1e-06 s

Total time: 3.0645 s
File: line_profiler_example.py
Function: get_data_from_apis at line 5

Line #      Hits         Time  Per Hit   % Time  Line Contents
==============================================================
     5                                           @profile
     6                                           def get_data_from_apis():
     7                                               """Fetches data from multiple sources."""
     8         1    1023456.0 1023456.0     33.4      response1 = requests.get('https://httpbin.org/delay/1')
     9         1      12345.0   12345.0      0.4      data1 = response1.json()
    10
    11         1    2027890.0 2027890.0     66.2      response2 = requests.get('https://httpbin.org/delay/2')
    12         1       8765.0    8765.0      0.3      data2 = response2.json()
    13
    14                                               # Some processing
    15         1         35.0      35.0      0.0      combined_keys = list(data1.keys()) + list(data2.keys())
    16         1         12.0      12.0      0.0      print(f"Combined keys: {len(combined_keys)}")
This output immediately reveals that the vast majority of the time (33.4% and 66.2%) is spent on the two requests.get() calls, which are I/O-bound operations.
From Identification to Optimization: Common Scenarios
Once you’ve identified a bottleneck, the next step is to fix it. The right strategy depends heavily on the nature of the problem.
Inefficient Algorithms and Data Structures
This is often the source of the most dramatic performance improvements. A change in algorithm can take an operation from being unusably slow to instantaneous. A classic example is searching for an item in a collection.

# list vs. set lookup
import timeit

large_list = list(range(100000))
large_set = set(large_list)
search_item = 99999

# Time list lookup
list_time = timeit.timeit(lambda: search_item in large_list, number=1000)
# Time set lookup
set_time = timeit.timeit(lambda: search_item in large_set, number=1000)

print(f"List lookup time: {list_time:.6f} seconds")
print(f"Set lookup time: {set_time:.6f} seconds")

# Output might be:
# List lookup time: 0.234567 seconds
# Set lookup time: 0.000098 seconds
Searching a list is an O(n) operation, meaning the time it takes grows linearly with the size of the list. In contrast, searching a set is, on average, an O(1) operation, meaning the time is constant regardless of size. The performance difference is staggering and highlights the importance of choosing the right data structure for the job.
I/O-Bound vs. CPU-Bound Operations
It’s vital to distinguish between I/O-bound and CPU-bound tasks.
- I/O-Bound: The program spends most of its time waiting for external operations to complete, such as reading from a disk, making a network request, or querying a database. The CPU is idle during this time.
- CPU-Bound: The program is busy performing computations, such as complex mathematical calculations, image processing, or data compression. The CPU is the limiting factor.
The optimization strategies for each are completely different. For I/O-bound tasks, concurrency using asyncio is the ideal solution. It allows the program to start other I/O operations while waiting for the current one to finish. For CPU-bound tasks, where the Global Interpreter Lock (GIL) prevents true parallelism in threads, the multiprocessing module is the answer. It spawns separate processes, each with its own Python interpreter and memory space, allowing tasks to run on different CPU cores simultaneously. Staying updated with the latest **python news** can reveal new libraries and techniques for handling these challenges, as the ecosystem is constantly evolving.
Advanced Techniques: Memory Profiling and Best Practices
Performance isn’t just about speed; it’s also about memory efficiency. High memory usage can lead to slow performance due to swapping and can even crash your application.
Hunting for Memory Leaks with memory_profiler
In Python, memory is managed automatically by a garbage collector. However, “memory leaks” can still occur if you unintentionally keep references to objects that are no longer needed, preventing them from being cleaned up. The memory_profiler tool works similarly to line_profiler, showing memory consumption on a line-by-line basis.
Consider this example where a large list is held in memory unnecessarily:
# memory_example.py
@profile
def process_data():
    large_data = [i for i in range(10**6)] # 1 million integers
    # Do something with the data
    total = sum(large_data)
    # The 'large_data' list is no longer needed but is still in scope
    return total

if __name__ == "__main__":
    process_data()
Running this with python -m memory_profiler memory_example.py will show a significant memory spike on the line where large_data is created and that memory remains allocated until the function returns. A better approach for large datasets might be to use a generator to process items one by one, keeping memory usage low and constant.
General Optimization Best Practices
- Use Built-in Functions and Libraries: Functions like
map(),filter(), and libraries like NumPy are often implemented in C and are significantly faster than pure Python equivalents for their respective tasks. - Leverage Caching with
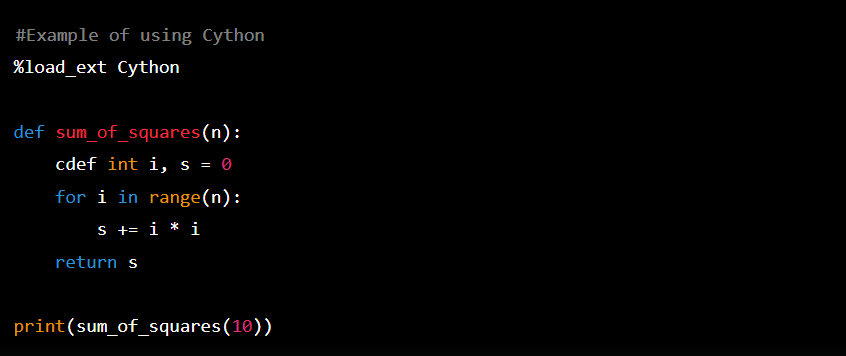
functools.lru_cache: For expensive functions that are called repeatedly with the same arguments, use the@lru_cachedecorator to memoize the results. This can provide a massive speedup by trading a small amount of memory for CPU time. - Consider Cython or Numba: When you’ve identified a small, CPU-bound function as a major bottleneck and algorithmic changes aren’t enough, tools like Cython or Numba can compile your Python code to near-C speeds.
Conclusion: The Art and Science of Python Optimization
Python performance optimization is a systematic process, not a dark art. It begins with resisting the urge to optimize prematurely and instead focusing on writing clean, functional code. The journey truly starts with measurement—establishing a baseline and using powerful profiling tools like cProfile, line_profiler, and memory_profiler to get a clear, data-driven picture of where your application spends its time and resources. By identifying the true bottlenecks, whether they are inefficient algorithms, I/O waits, or memory bloat, you can apply targeted, high-impact solutions. Remember to focus your efforts on the 20% of the code that causes 80% of the delay. By embracing this methodical approach, you can transform sluggish applications into efficient, scalable, and robust systems, elevating your skills as a Python developer and delivering a superior experience to your users.

