Python Performance Profiling and Optimization – Part 4
Welcome to the fourth installment of our comprehensive series on Python performance. In the previous parts, we laid the groundwork by exploring fundamental tools like cProfile and the importance of benchmarking. Now, we venture into the deep end, tackling advanced profiling techniques, memory management intricacies, and sophisticated optimization strategies. High-performance Python is not an oxymoron; it’s the result of a methodical, data-driven approach to identifying and eliminating bottlenecks. This article will equip you with the advanced tools and mental models necessary to transform sluggish applications into highly responsive and efficient systems. We will move beyond simple time-based analysis to dissect memory usage, visualize performance hotspots with flame graphs, and implement powerful optimizations for both CPU-bound and I/O-bound workloads. Whether you’re building a data-intensive scientific application, a high-traffic web service, or a complex backend system, mastering these techniques is crucial for delivering a robust and scalable product.
Moving Beyond the Standard Library: Advanced Profiling Tools
While Python’s built-in cProfile is an excellent starting point, its text-based output can be dense and difficult to parse for complex applications. To gain deeper, more actionable insights, we must turn to more specialized third-party tools. These profilers provide granular detail and intuitive visualizations that help pinpoint the exact sources of inefficiency, moving us from “which function is slow?” to “which line in that function is the problem?”.
Pinpointing Inefficiency with line_profiler
Often, a bottleneck isn’t the entire function, but a single, expensive line within it—perhaps an inefficient list comprehension or a poorly constructed loop. This is where line_profiler shines. It analyzes the execution time of a function on a line-by-line basis, revealing precisely where the CPU cycles are being spent.
To use it, you first install it (pip install line_profiler) and then decorate the function you want to inspect with @profile. Note that @profile is not a built-in; it’s added to the global namespace when you run the script with the kernprof command-line utility that comes with the library.
Consider this example function that processes some data:
# To be run with: kernprof -l -v your_script.py
import time

@profile
def process_data(data):
    # An expensive, perhaps unnecessary, sorting operation
    sorted_data = sorted(data * 10)

    # A list comprehension that could be slow
    results = [i**2 for i in sorted_data if i % 2 == 0]

    # A less expensive operation
    time.sleep(0.1) # Simulate some other work

    return len(results)

if __name__ == "__main__":
    initial_data = list(range(10000))
    process_data(initial_data)
Running this with kernprof -l -v process_data.py will produce a detailed report showing the time spent on each line, the number of times each line was hit, and the percentage of time consumed. This immediately highlights whether the sorting or the list comprehension is the true culprit, allowing you to focus your optimization efforts with surgical precision.
Visualizing Performance with py-spy and Flame Graphs
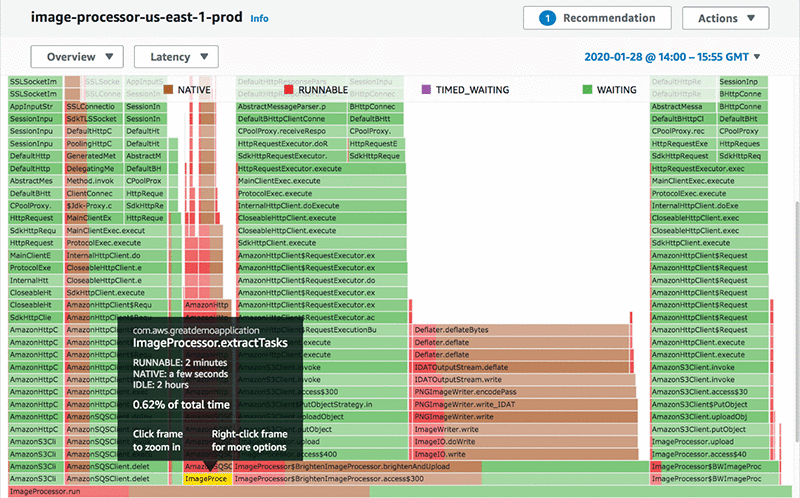
For applications already running in production or complex systems where modifying the source code is impractical, a sampling profiler like py-spy is invaluable. It can attach to any running Python process and collect performance data with very low overhead, making it safe for production environments. One of its most powerful features is the ability to generate flame graphs.
A flame graph is a visualization of a program’s call stack. The x-axis represents the total time spent, and the y-axis represents the stack depth. Wider bars indicate functions that were on the CPU for a longer time, and the functions they call appear stacked on top of them. By looking for the widest plateaus at the top of the graph, you can instantly identify the most time-consuming parts of your code. This visual approach is often far more intuitive than reading through pages of statistical output.
Conquering Memory Usage: Profiling and Leak Detection
CPU performance is only half the battle. Excessive memory consumption can be just as detrimental, leading to slowdowns from operating system memory swapping or outright crashes from out-of-memory errors. Effective memory profiling is a critical skill for building robust, long-running applications.
Tracking Memory Allocation with memory-profiler
Similar to how line_profiler works for CPU time, the memory-profiler library provides line-by-line analysis of memory consumption. It helps answer questions like, “Which step in my data processing pipeline is creating that giant list?” or “Is this data structure larger than I expected?”.
Using it is straightforward. After installation (pip install memory-profiler), you can decorate a function with @profile and run your script with a special flag.

# To be run with: python -m memory_profiler your_script.py
import numpy as np

@profile
def create_large_structures():
    # Step 1: Create a large list of integers
    list_a = [i for i in range(10**6)]

    # Step 2: Create a large NumPy array
    array_b = np.ones((1000, 1000))

    # Step 3: Create another large list
    list_c = list_a * 2

    total = len(list_a) + array_b.size + len(list_c)
    del list_a, array_b, list_c # Explicitly free memory
    return total

if __name__ == "__main__":
    create_large_structures()
The output will show the memory usage at the start of the function and the memory increment after each line is executed. This makes it incredibly easy to spot which data structures are responsible for memory spikes.
Detecting Memory Leaks with tracemalloc
Memory leaks are insidious bugs where memory is allocated but never released, causing an application’s memory footprint to grow indefinitely until it crashes. In Python, leaks often occur due to unexpected object references that prevent the garbage collector from reclaiming memory. The standard library’s tracemalloc module is a powerful tool for hunting down these leaks.
The core strategy is to take “snapshots” of memory allocation at different points in time and compare them. Staying updated on tools like tracemalloc is a key part of keeping up with **python news** and best practices. Here’s a typical workflow:
- Start tracing with
tracemalloc.start(). - Take an initial snapshot of memory allocations.
- Run the section of code you suspect is leaking.
- Take a second snapshot.
- Compare the two snapshots to see which allocations have grown the most.
import tracemalloc
import gc

leaky_list = []

def add_to_leaky_list(n):
    leaky_list.extend(range(n))

tracemalloc.start()

# --- Snapshot 1: Before the operation ---
snap1 = tracemalloc.take_snapshot()

# Run the potentially leaky function multiple times
for _ in range(5):
    add_to_leaky_list(10**5)
    gc.collect() # Force garbage collection

# --- Snapshot 2: After the operation ---
snap2 = tracemalloc.take_snapshot()

# --- Compare the snapshots ---
top_stats = snap2.compare_to(snap1, 'lineno')

print("[ Top 10 memory differences ]")
for stat in top_stats[:10]:
    print(stat)
The output of compare_to will point you directly to the line of code responsible for the new, un-freed memory allocations, making it possible to find and fix even the most obscure leaks.
Actionable Optimization: Strategies for Real-World Code
Once you’ve used profiling tools to identify a bottleneck, the next step is to fix it. The right optimization strategy depends heavily on the nature of the bottleneck: is your code limited by the CPU’s processing speed (CPU-bound) or by waiting for external resources like a network or disk (I/O-bound)?

Optimizing CPU-Bound Code
CPU-bound tasks are those that involve heavy computation, such as mathematical calculations, data transformation, or image processing.
- Algorithmic Improvements: This is always the most impactful optimization. No amount of low-level tuning can fix a fundamentally inefficient algorithm. For example, changing a search in a list (O(n) complexity) to a lookup in a set or dictionary (O(1) average complexity) can yield orders-of-magnitude performance gains.
- Leverage C-level Implementations: Python’s standard library and popular packages like NumPy are highly optimized because their core operations are written in C. Prefer built-in functions (e.g.,
sum(),map()) and library operations (e.g., NumPy vectorization) over manual Python loops whenever possible. - Just-In-Time (JIT) Compilation: For numerically-intensive code, libraries like Numba can provide dramatic speedups. Numba’s
@jitdecorator translates your Python functions into optimized machine code at runtime, often bringing performance close to that of compiled languages like C or Fortran, without having to write in another language.
Tackling I/O-Bound Bottlenecks
I/O-bound tasks spend most of their time waiting—for a database query to return, an API call to complete, or a file to be read from disk. During this waiting period, the CPU is idle. The key to optimizing these tasks is to use that idle time productively.
- Concurrency with
asyncio: Python’sasyncioframework is designed for this exact problem. Using theasyncandawaitsyntax, you can write code that initiates an I/O operation (e.g., an HTTP request) and then immediately yields control, allowing the program to work on other tasks. When the I/O operation completes, the program resumes where it left off. This allows a single thread to manage thousands of concurrent I/O operations efficiently. - Parallelism with
multiprocessing: For CPU-bound tasks that can be broken into independent chunks, themultiprocessingmodule can be used to run them in parallel on different CPU cores. Unlike threading, which is limited by the Global Interpreter Lock (GIL), multiprocessing spawns separate processes, each with its own Python interpreter and memory space, allowing for true parallelism and full utilization of modern multi-core processors.
The Optimization Mindset: Best Practices and Pitfalls
Effective optimization is as much about discipline and mindset as it is about tools. Applying changes without a clear, data-driven strategy can lead to more harm than good, resulting in complex, unmaintainable code with little to no actual performance benefit.
The Golden Rules of Optimization
- Profile First, Optimize Second: As Donald Knuth famously said, “Premature optimization is the root of all evil.” Never optimize based on intuition alone. Your assumptions about what is slow are often wrong. Use a profiler to find the actual, data-supported hotspots before you write a single line of optimization code.
- Measure, Don’t Guess: Every optimization you make should be validated with a benchmark. Measure the performance before and after your change under realistic conditions. If the change doesn’t produce a significant improvement, revert it. The cost of increased code complexity may not be worth a negligible gain.
- Focus on the 80/20 Rule: In most applications, 80% of the execution time is spent in 20% of the code. Your profiling efforts will reveal this “hot 20%”. Focus all your energy there; optimizing code that is rarely executed is a waste of time.
Common Pitfalls to Avoid
- Over-optimizing Trivial Code: Spending days to shave microseconds off a function that only contributes 1% to the total runtime.
- Ignoring High-Level Design: Focusing on micro-optimizations (e.g., using `x+=1` instead of `x=x+1`) while ignoring a major architectural or algorithmic flaw, like making N+1 queries to a database.
- Sacrificing Readability for Minor Gains: Writing cryptic, “clever” code that is hard to debug and maintain for a performance improvement that could have been achieved in a cleaner way. Clean, readable code is often fast enough, and it’s always easier to optimize later if needed.
Conclusion: Becoming a Performance-Oriented Developer
We’ve journeyed from advanced CPU profiling with tools like line_profiler and py-spy to the critical domain of memory management using memory-profiler and tracemalloc. We’ve explored concrete strategies for optimizing both CPU-bound and I/O-bound workloads, from algorithmic improvements to modern concurrency models. The overarching lesson is that performance optimization is a systematic process: identify bottlenecks with data, formulate a hypothesis, implement a change, and verify the impact with rigorous measurement. By internalizing this workflow and adopting the best practices discussed, you can elevate your skills and consistently build Python applications that are not only functional and correct but also fast, efficient, and scalable. Performance is a feature, and with these advanced techniques in your arsenal, it’s a feature you can confidently deliver.

