Machine Learning Model Deployment with Python – Part 4
Welcome back to our comprehensive series on deploying machine learning models in production using Python. In the previous installments, we explored the fundamentals of saving models, building basic APIs with Flask and FastAPI, and preparing our applications for deployment. Now, in Part 4, we elevate our approach from a simple, functioning prototype to a robust, scalable, and resilient production-grade system. This is where the real-world challenges of MLOps (Machine Learning Operations) come into play.
This step-by-step guide will navigate the advanced techniques essential for real-world applications. We will move beyond running a single script on a server and dive deep into the ecosystem that powers modern AI products. We’ll cover containerization with Docker to ensure consistency, orchestration with Kubernetes for scaling and self-healing, sophisticated model serving patterns, and the critical importance of monitoring for model drift and performance degradation. By the end of this article, you will understand the principles and practices required to build and maintain machine learning services that are not only accurate but also reliable and efficient at scale.
The Evolution from Prototype to Production-Grade Service
A common pitfall for data science teams is underestimating the gap between a working model in a Jupyter Notebook and a reliable service in production. Running a Python script with python app.py on a virtual machine is a great start, but it’s fraught with peril in a production environment. What happens if the server reboots? How do you handle a sudden surge in traffic? How do you update the model without downtime? How do you ensure the production environment exactly matches the development environment? These questions highlight the limitations of a simplistic approach.
To address these challenges, the industry has adopted a set of practices and tools collectively known as MLOps. A modern MLOps stack transforms a fragile script into a resilient, manageable service. This involves abstracting away the underlying infrastructure and automating the lifecycle of the ML model.
Key Pillars of Production ML Deployment
A production-ready system is built on several core pillars that work in concert to deliver reliability and scalability. Understanding these components is the first step toward building a professional deployment pipeline.
- Containerization: This is the process of packaging an application, along with all its dependencies, libraries, and configuration files, into a single, isolated unit called a container. The primary tool for this is Docker. Containerization solves the “it works on my machine” problem by creating a consistent and reproducible environment that runs identically anywhere—from a developer’s laptop to a production server cluster.
- Orchestration: Once you have a container, you need a system to manage its lifecycle, especially when you need to run multiple copies for high availability and load balancing. Container orchestrators, with Kubernetes (K8s) being the de facto standard, automate the deployment, scaling, and management of containerized applications. They handle tasks like restarting failed containers, distributing traffic, and performing rolling updates.
- Model Serving: This refers to the process of making your model available for inference via a network request, typically a REST or gRPC API. While frameworks like FastAPI are excellent for building the API layer, dedicated model serving tools like NVIDIA Triton Inference Server, TorchServe, or TensorFlow Serving offer high-performance features like dynamic batching, GPU optimization, and multi-model management out of the box.
- Monitoring & Observability: In a traditional software application, you monitor system metrics like CPU usage, memory, and latency. For ML systems, this is not enough. You must also monitor model-specific metrics. This includes tracking prediction accuracy, detecting data drift (when production data statistics diverge from training data), and identifying concept drift (when the underlying relationships the model learned have changed).
Deep Dive: Containerization and Orchestration
Let’s get practical. The first step in professionalizing our deployment is to containerize the Python application. This ensures that our model, code, and dependencies are locked together in a portable image.
Containerizing Your Python ML Application with Docker
A Dockerfile is a text file that contains a set of instructions for building a Docker image. It’s like a recipe for creating your application’s environment. Let’s assume we have a simple FastAPI application that serves a pre-trained scikit-learn model.
Our project structure might look like this:
/app
|-- main.py         # FastAPI application
|-- model.joblib    # Trained scikit-learn model
|-- requirements.txt # Python dependencies
|-- Dockerfile      # Docker instructions
Here is a detailed, production-ready Dockerfile:
# Stage 1: Use an official Python runtime as a parent image
# Using a specific version ensures reproducibility
FROM python:3.9-slim

# Set the working directory inside the container
WORKDIR /app

# Copy the requirements file first to leverage Docker's layer caching
# This layer will only be rebuilt if requirements.txt changes
COPY requirements.txt .

# Install any needed packages specified in requirements.txt
# --no-cache-dir reduces image size, --upgrade pip is good practice
RUN pip install --no-cache-dir --upgrade pip && \
    pip install --no-cache-dir -r requirements.txt

# Copy the rest of the application code into the container
COPY . .

# Expose the port the app runs on
EXPOSE 8000

# Define the command to run your app using a production-grade server like Uvicorn
# The --host 0.0.0.0 makes the server accessible from outside the container
CMD ["uvicorn", "main:app", "--host", "0.0.0.0", "--port", "8000"]
To build this image, you would run docker build -t my-ml-app:latest . in your terminal. This command creates a self-contained image named my-ml-app that you can run anywhere Docker is installed.
Managing Containers at Scale with Kubernetes (K8s)
Running a single Docker container is simple. But what if you need to run 10 identical containers to handle traffic and ensure that if one fails, another takes its place? This is where Kubernetes comes in. K8s allows you to declaratively define the desired state of your application, and it works tirelessly to maintain that state.

Here are the core K8s concepts you’ll use:
- Pod: The smallest deployable unit in Kubernetes. It’s a wrapper around one or more containers.
- Deployment: A controller that manages the lifecycle of Pods. You tell a Deployment you want three replicas of your app, and it ensures three Pods are always running. It also manages rolling updates.
- Service: An abstraction that defines a logical set of Pods and a policy by which to access them. It provides a stable IP address and DNS name, so even if Pods are created or destroyed, the entry point to your application remains the same.
Here is a basic Kubernetes deployment.yaml file to run three replicas of our containerized ML app:
apiVersion: apps/v1
kind: Deployment
metadata:
  name: ml-model-deployment
spec:
  replicas: 3 # We want three instances of our app running
  selector:
    matchLabels:
      app: my-ml-app
  template:
    metadata:
      labels:
        app: my-ml-app
    spec:
      containers:
      - name: ml-api-container
        image: my-ml-app:latest # The Docker image we built
        ports:
        - containerPort: 8000
---
apiVersion: v1
kind: Service
metadata:
  name: ml-model-service
spec:
  type: LoadBalancer # Exposes the service externally using a cloud provider's load balancer
  selector:
    app: my-ml-app
  ports:
    - protocol: TCP
      port: 80       # The port the service is exposed on
      targetPort: 8000 # The port the container is listening on
By applying this configuration to a Kubernetes cluster (kubectl apply -f deployment.yaml), K8s will automatically pull your Docker image, create three Pods, and set up a load balancer to distribute incoming traffic evenly among them. This provides both scalability and resilience.
Advanced Model Serving and Scaling Strategies
With our application containerized and orchestrated, we can now focus on optimizing how the model serves predictions and how the system scales under load.
Choosing the Right Model Serving Framework
While FastAPI is fantastic, for high-throughput or low-latency requirements, specialized serving frameworks offer significant advantages. Recent python news and developments in the MLOps space have led to incredibly powerful open-source tools.
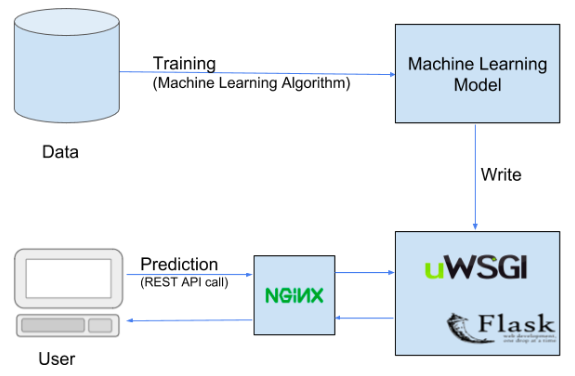
- Custom API (FastAPI/Flask):
- Pros: Maximum flexibility, easy to integrate with other business logic, simple to get started.
- Cons: You are responsible for implementing performance optimizations like request batching, managing GPU memory, and handling concurrent requests efficiently.
- Dedicated Serving Frameworks (e.g., NVIDIA Triton, TorchServe):
- Pros: Built for performance. They offer features like dynamic batching (grouping individual requests into a batch to leverage hardware parallelism), multi-model serving from a single instance, and optimized execution on CPUs and GPUs.
- Cons: Can be more complex to configure and may be overkill for simple models with low traffic.
- Serverless (e.g., AWS Lambda, Google Cloud Functions):
- Pros: Completely managed infrastructure, auto-scaling, and a pay-per-use pricing model, which is excellent for sporadic workloads.
- Cons: Suffer from “cold starts” (latency on the first request after a period of inactivity), and have limitations on deployment package size and memory, which can be problematic for large models.
Implementing Effective Scaling Strategies
Kubernetes provides powerful mechanisms for automatic scaling.
- Horizontal Scaling (Scaling Out): This is the most common strategy, where you add more instances (Pods) of your application to handle increased load. The Kubernetes HorizontalPodAutoscaler (HPA) can do this automatically based on observed metrics like CPU utilization or custom metrics like requests per second. For example, you can configure an HPA to add a new Pod whenever the average CPU utilization across all Pods exceeds 70%.
- Canary Deployments & A/B Testing: When deploying a new model version, it’s risky to switch all traffic at once. A safer approach is a canary deployment. You deploy the new model version alongside the old one and initially route only a small fraction of traffic (e.g., 1%) to it. You monitor the new version’s performance and error rates closely. If it performs well, you gradually increase its traffic until it handles 100%, at which point you can decommission the old version. This pattern is crucial for de-risking model updates.
Monitoring, Observability, and Maintaining Model Health
Deployment is not the end of the journey; it’s the beginning of the operational phase. A model that was highly accurate during training can and will degrade in production. Monitoring is the process of detecting this degradation.
Beyond System Metrics: The Uniqueness of ML Monitoring
Standard application performance monitoring (APM) tools track CPU, memory, latency, and error rates. These are essential, but for ML systems, they are insufficient. We must also monitor the quality and behavior of the model’s predictions.
Key Areas for ML Model Monitoring
- Data and Concept Drift: This is the most critical area of ML monitoring. Data drift occurs when the statistical properties of the data the model sees in production differ from the data it was trained on. For example, a loan approval model trained on pre-pandemic data might perform poorly on post-pandemic applications because user financial behaviors have changed. Concept drift is when the relationship between the input features and the target variable changes. Monitoring for drift involves comparing the distribution of incoming prediction data against a baseline (the training data) using statistical tests like the Kolmogorov-Smirnov (K-S) test.
- Model Performance Degradation: If you have a mechanism to collect ground truth labels for your predictions (a feedback loop), you can track traditional ML metrics like accuracy, F1-score, or RMSE over time. A sudden drop in these metrics is a clear signal that the model needs to be retrained or re-evaluated.
- Prediction Outliers: Monitoring the distribution of your model’s outputs can also be insightful. A sudden shift in the average prediction value or the appearance of extreme outliers can indicate a problem with either the incoming data or the model itself.
To implement this, you need an observability stack. A popular open-source combination is using Prometheus to scrape and store time-series metrics and Grafana to build dashboards for visualization. You would instrument your Python application to expose custom metrics, such as a histogram of prediction scores or a counter for features that fall outside their expected range. For more advanced use cases, dedicated MLOps monitoring platforms like Fiddler, Arize, or WhyLabs provide sophisticated drift detection and model explainability features out of the box.
Conclusion
Transitioning a machine learning model from a research environment to a robust production service is a complex but essential discipline. In this fourth part of our series, we have bridged that gap by introducing the core pillars of modern MLOps: containerization with Docker for reproducibility, orchestration with Kubernetes for scalability and resilience, advanced serving patterns for performance, and comprehensive monitoring for maintaining model health. By adopting these techniques, you move beyond simply deploying a model to engineering a reliable, scalable, and maintainable AI-powered system. The journey doesn’t end here; it becomes a continuous cycle of monitoring, retraining, and redeploying to ensure your model consistently delivers value in a dynamic world.
