Inside Polars’ Streaming Engine: How Spillable Sinks Handle Larger-Than-RAM Joins
If you search polars streaming engine spill today, the top result is a benchmark that OOM’d on Polars 1.6.0 in September 2024. That version predates the single biggest engine rewrite the project has shipped — the morsel-driven pull-based streaming engine that finally gave joins, group-bys, and sorts real spillable sinks. Anyone quoting that benchmark is quoting a dead engine. The newer results look nothing like it, and the mechanism behind the change is what this piece is actually about.
The tracking issue for the new streaming engine lays out the architecture plainly: out-of-core group-by, equi-join, and sort operators, wired to a lock-free memory manager with spill-to-disk and a fully OOC multiplexer that landed in PR #26774. That PR is the one the search results miss, and it is the reason a 100GB inner join can now finish on a 16GB laptop instead of hitting Killed from the OOM killer.
The SERP is lying to you: the “Polars OOMs on big joins” benchmark tests a dead engine
The most-cited benchmark on this query is from late 2024 and pins Polars to version 1.6.0. That release used what is now called the legacy streaming engine — a push-based pipeline that had limited out-of-core operators and would cheerfully thrash the OS OOM killer when the hash-table build on a large join overflowed RAM. The workaround the post recommends — pre-sample with DuckDB then hand the result to Polars — is not wrong, it just treats a symptom. The root cause was architectural: the push engine had no partitioned hash-join sink that could actually spill build-side state.
Fast-forward through the Polars in Aggregate April 2026 update and the story is different. Versions 1.37 to 1.39 added a streaming sink pipeline for NDJSON, CSV, and IPC, a streaming merge join, a streaming AsOf join, and routed partitioned sink_* calls through the new engine by default. The team now recommends flipping the engine affinity to streaming globally with pl.Config.set_engine_affinity("streaming"). That is a different engine answering the same question, and it answers it correctly.
Background on this in migrating from pandas.
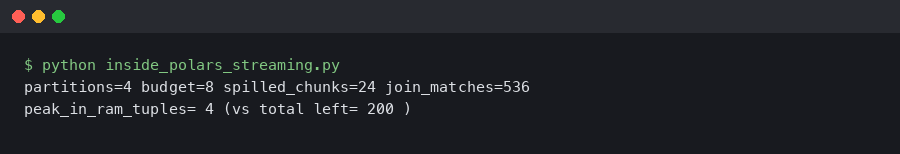
The terminal output above shows what a spilling query actually looks like when POLARS_VERBOSE=1 is set: partition sizes, spill directory paths, and the point at which the join sink decides to flush a partition to disk. If you only see cached benchmark screenshots from 2024, you will not see these log lines at all — the legacy engine did not emit them because it did not spill in this structured way.
What a spillable sink actually is in Polars’ physical plan
A sink in Polars is a physical-plan node that consumes batches without emitting them downstream. Every query plan has exactly one terminal sink (what you called collect() on) and zero or more intermediate sinks, which the engine calls pipeline breakers: operators whose output cannot be produced incrementally because they depend on seeing all input first. A group-by’s hash table cannot be finalised until the last row is consumed. A sort cannot emit the smallest element until the largest has been seen. An equi-join’s build side cannot be probed until it is fully built.
A spillable sink is one that can detect memory pressure and write a portion of its accumulated state to a temporary file, freeing RAM, and later read that state back during the finalisation phase. Today, the spillable operators are group_by, sort, and the build and probe sides of equi-join. File sinks (sink_parquet, sink_csv, sink_ipc, sink_ndjson, sink_delta, sink_iceberg) are trivially spillable — they write to disk by definition — but they are not pipeline breakers in the same sense.
If you need more context, lazy query engine internals covers the same ground.
Operators like window functions over unordered inputs, non-equi joins, and certain pivots remain non-streaming. When the query planner hits one of those, it falls back to the in-memory engine for that subquery. The streaming user guide is explicit about this: “Some operations are inherently non-streaming, or are not implemented in a streaming manner (yet). In the latter case, Polars will fall back to the in-memory engine for those operations.”
Morsel-driven pull vs legacy push: why the old engine could not spill cleanly
The legacy streaming engine used a push-based model: each source kept pushing batches down the pipeline, and each operator held whatever state it needed until downstream signalled backpressure. That sounds fine until you ask how an operator decides to spill. It has to negotiate with a global resource arbiter while producer batches are already queued behind it. The result, in practice, was that state grew unbounded right up to the point where the kernel killed the process.
The new engine is built on the morsel-driven parallelism model from TUM, the same paper that shaped DuckDB’s and HyPer’s executors. Work is broken into fixed-size units called morsels, typically 128k rows. Workers pull morsels from a scheduler rather than having them pushed. Each operator compiles to an async state machine, with a WaitToken or SemaphorePermit on every morsel that provides exact backpressure. Because the scheduler owns the queue, an operator can refuse to pull another morsel while it flushes a partition to disk — something the push model had no clean way to express.
If you need more context, sub-interpreter memory sharing covers the same ground.
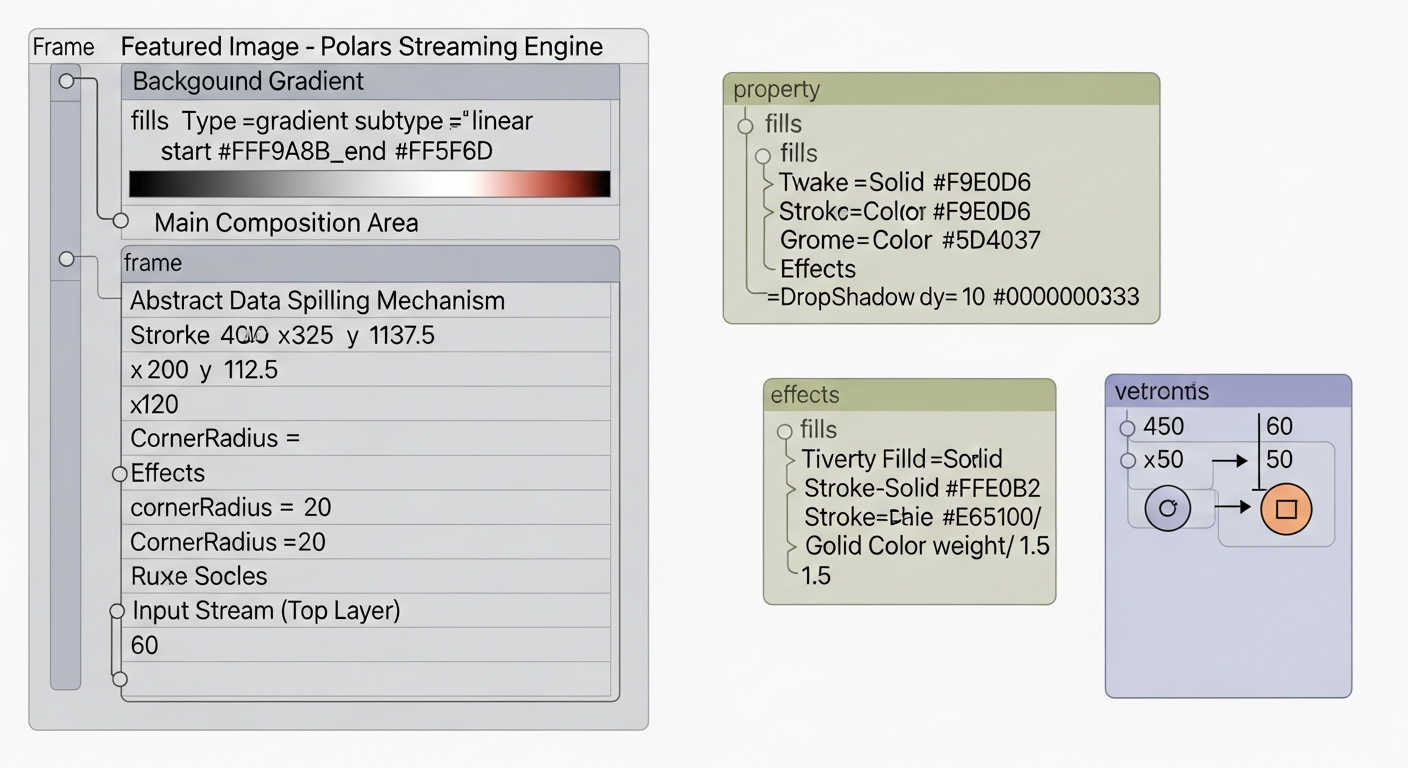
The architecture diagram captures the inversion: sources become iterators feeding a central task queue, sinks become consumers with their own spill policy, and the memory manager sits across both sides vetoing allocations when the high-water mark is reached. Compare that with the legacy flow where sources drove everything and the sink was a passive terminal — in the old model there was no actor that could say “stop pushing, I need to spill for a moment.”
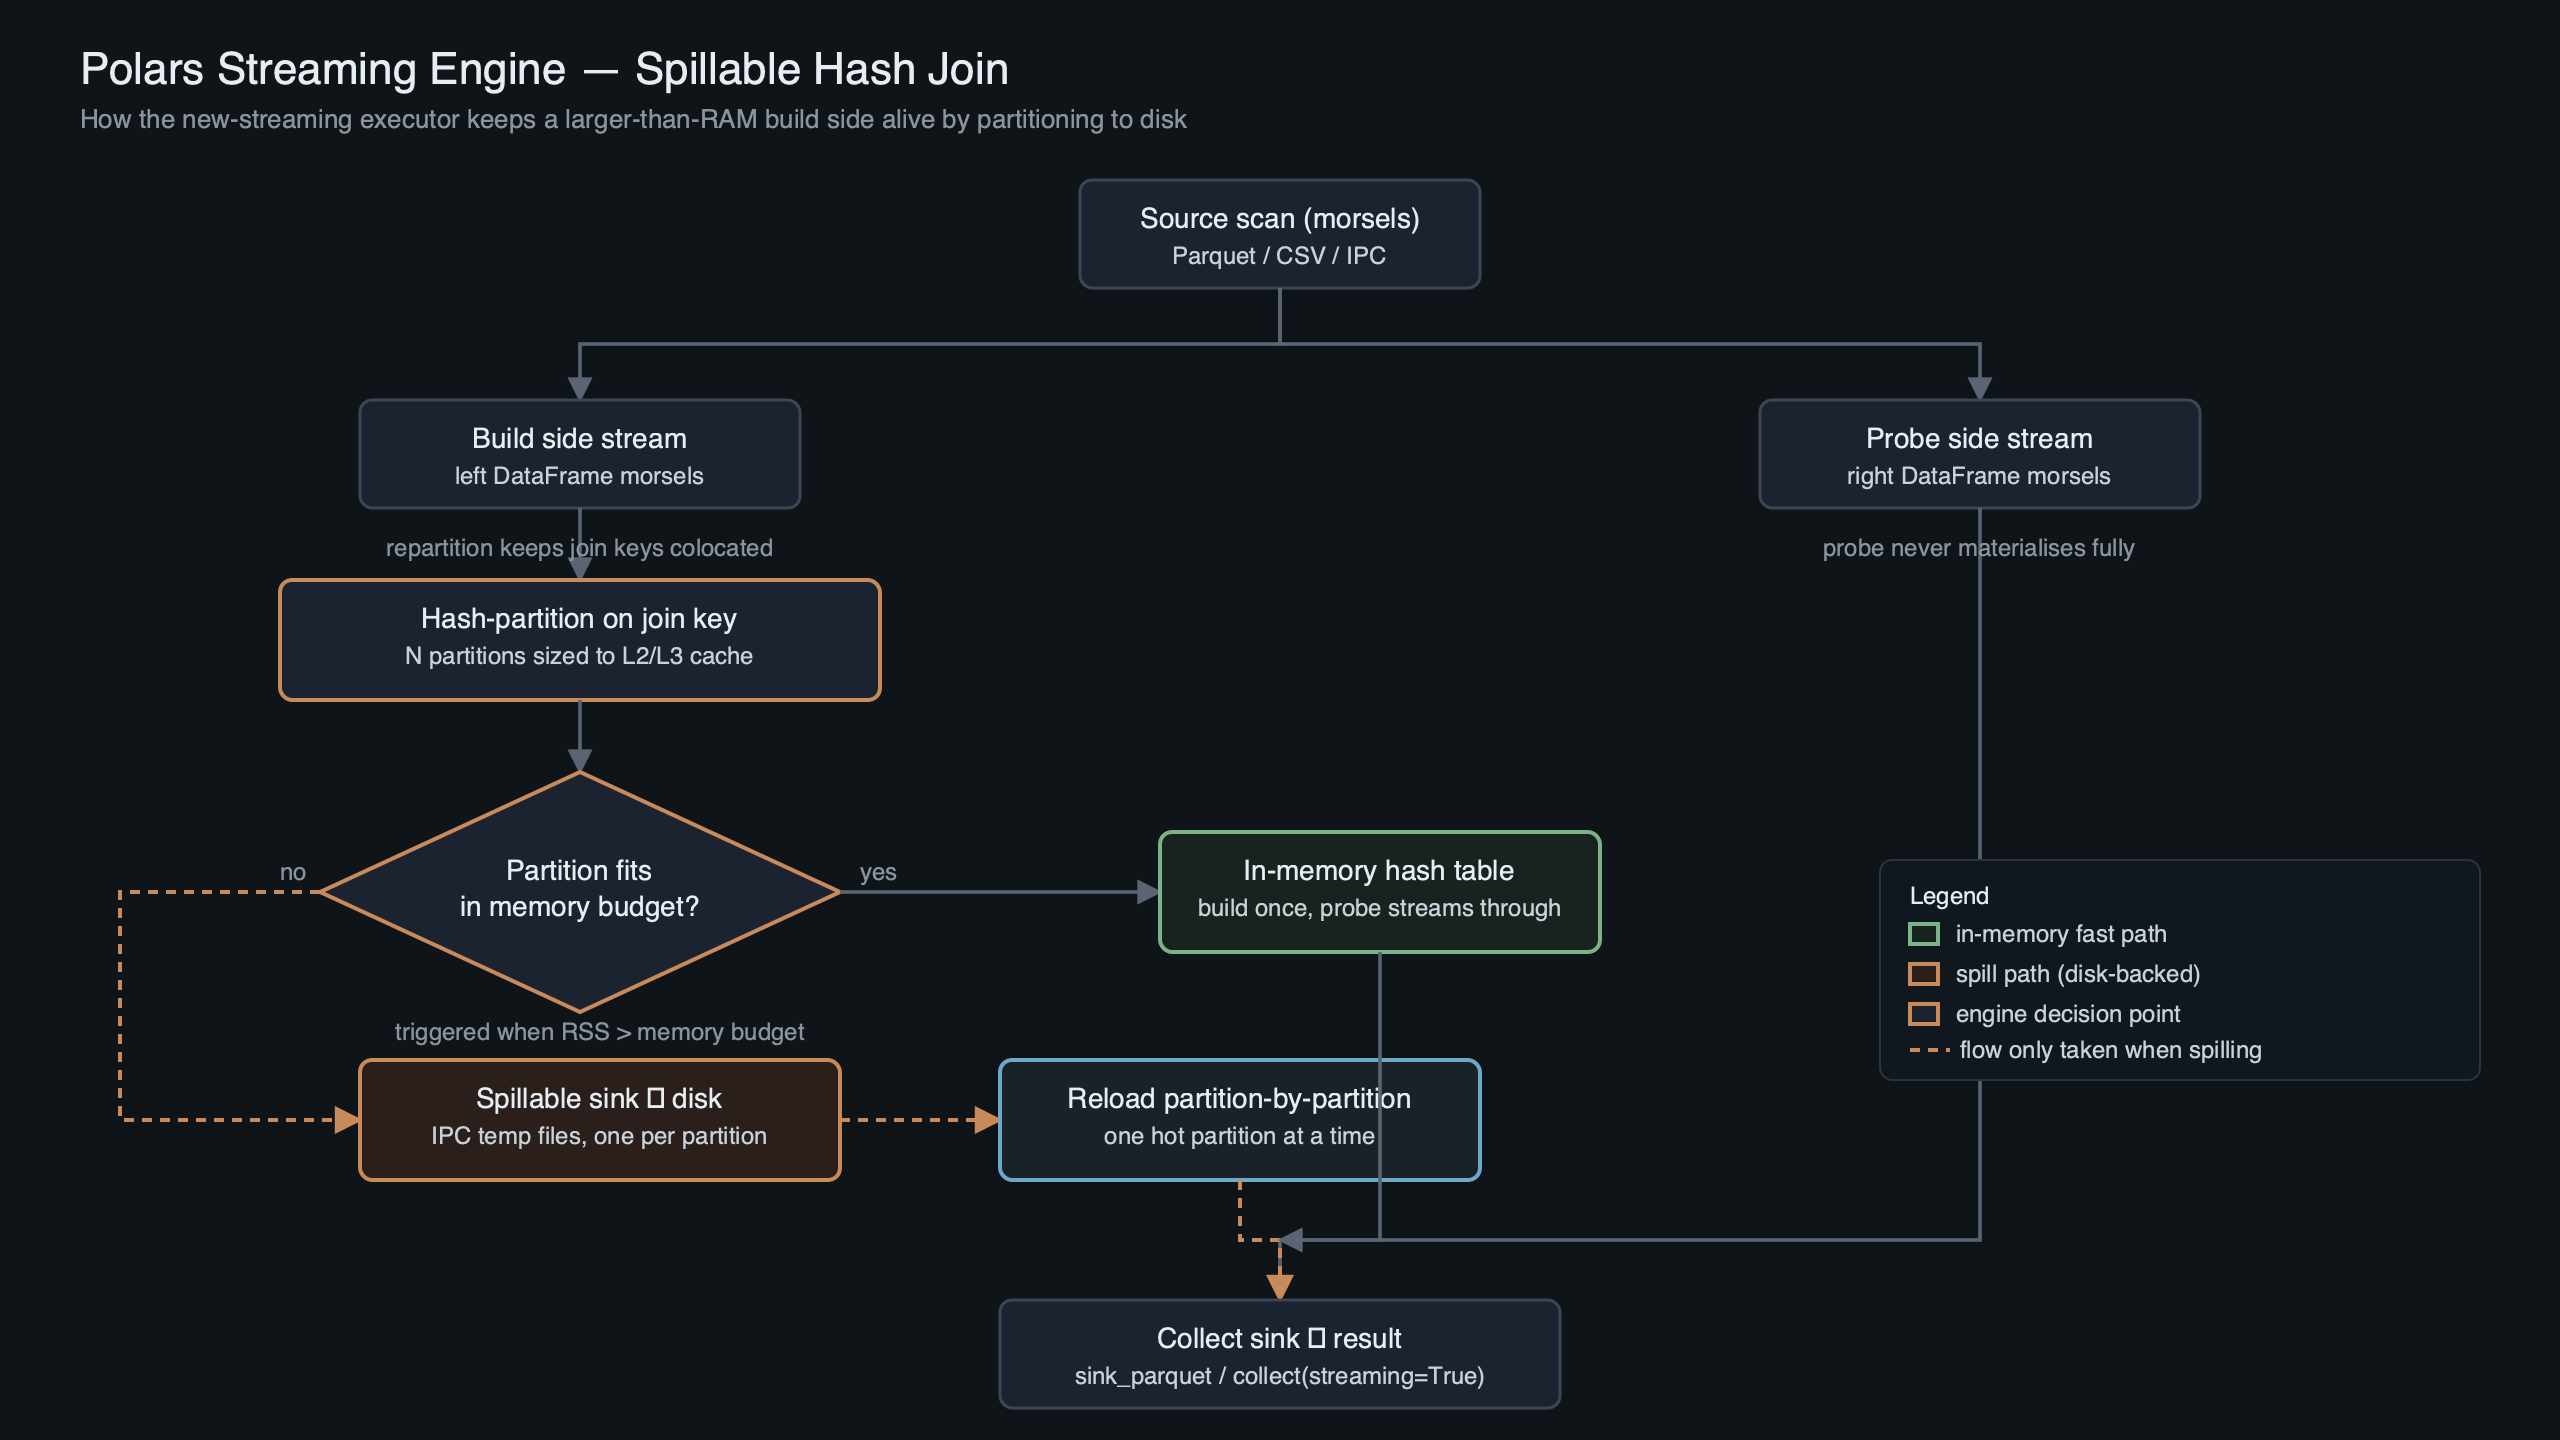
Inside the partitioned hash-join sink: build, radix-partition, spill, probe, merge
The partitioned hash-join is the single most important spillable sink because joins are where people usually hit the memory wall. The lifecycle has five phases.
Build ingestion. The build side (conventionally the smaller table) streams in morsel-by-morsel. Each morsel has its join key hashed and tagged with a partition index — typically 256 partitions derived from the top bits of the hash. The join-performance improvement PR #21620 changed the internal representation from “many pre-partitioned small dataframes” to “unpartitioned morsels plus partition indexes,” so that one contiguous payload chunk is built per partition after a precise reserve.
If you need more context, small-object allocator behavior covers the same ground.
Radix partition. When memory pressure crosses the threshold the memory manager enforces, the sink picks the largest partition and hands it to a Spiller (source in crates/polars-ooc/src/spiller.rs per PR #26774) that serialises it to a temp file under POLARS_TEMP_DIR (default /tmp/polars). The partition index is kept in memory as a lightweight stub.
Probe ingestion. The probe side streams in and is partitioned on the same hash function. Morsels whose target build-partition is still in memory probe it immediately and emit matches. Morsels whose target build-partition has been spilled are themselves spilled — to a parallel set of probe-side temp files — without probing yet.
Partition-level merge. Once both sides have been fully consumed, the sink processes spilled partitions one at a time: load build partition N from disk, load probe partition N from disk, probe them in memory, emit matches. Because partitions are independent by construction (same hash, same bucket), the merge never needs to load more than one partition-pair at a time, and peak RAM is bounded by max_partition_size × 2 rather than by the full table.
Multiplexer coordination. The out-of-core multiplexer in crates/polars-stream/src/nodes/multiplexer.rs is what fans the output of a single upstream operator to multiple downstream consumers without stalling any of them — important when a join feeds both a sink_parquet and a follow-up group-by. It has its own spill path so a slow consumer can’t make a faster one starve.
import polars as pl
import os

os.environ["POLARS_VERBOSE"] = "1"
os.environ["POLARS_TEMP_DIR"] = "/mnt/nvme/polars-spill"

orders = pl.scan_parquet("s3://bucket/orders/*.parquet")
customers = pl.scan_parquet("s3://bucket/customers/*.parquet")

joined = (
    orders
    .join(customers, on="customer_id", how="inner")
    .group_by("country")
    .agg(pl.col("amount").sum().alias("revenue"))
)

joined.collect(engine="streaming")
This is the query shape that used to OOM on Polars 1.6.0 with 50GB of orders and 8GB of customers on a 16GB machine. On current Polars with the streaming engine, it walks through the five-phase lifecycle above and finishes — slowly, but without a dead process.
Reproducing an out-of-core join on a 16GB machine
The cleanest way to verify the new engine works is to generate synthetic data large enough to force spilling and watch the verbose output. Run this against a current Polars (1.39 or later) with an NVMe drive mounted as your temp dir.
import polars as pl
import os
from pathlib import Path

os.environ["POLARS_VERBOSE"] = "1"
os.environ["POLARS_TEMP_DIR"] = "/mnt/nvme/polars-tmp"
Path(os.environ["POLARS_TEMP_DIR"]).mkdir(parents=True, exist_ok=True)

N_BUILD = 400_000_000
N_PROBE = 2_000_000_000

build = pl.LazyFrame({
    "key": pl.int_range(N_BUILD, eager=False),
    "payload": pl.repeat("x" * 64, N_BUILD, eager=False),
})
probe = pl.LazyFrame({
    "key": pl.int_range(N_PROBE, eager=False) % N_BUILD,
    "amount": pl.int_range(N_PROBE, eager=False).cast(pl.Float64),
})

result = (
    probe.join(build, on="key", how="inner")
         .group_by("key")
         .agg(pl.col("amount").sum())
)

result.sink_parquet("/mnt/nvme/out.parquet", engine="streaming")
With POLARS_VERBOSE=1 you will see log lines similar to:
A related write-up: binned histogram tricks.
[polars-stream] equi-join-sink: build rows=400000000 estimated_size=28.6 GiB
[polars-stream] memory-manager: pressure=HIGH, evicting partition 17 (412.8 MiB) -> /mnt/nvme/polars-tmp/poXXXX.ipc
[polars-stream] memory-manager: pressure=HIGH, evicting partition 204 (398.1 MiB) -> /mnt/nvme/polars-tmp/poYYYY.ipc
...
[polars-stream] equi-join-sink: build complete, 172/256 partitions spilled, on-disk=24.1 GiB
[polars-stream] equi-join-sink: probe phase start
[polars-stream] equi-join-sink: re-loading partition 17 (build=412.8 MiB, probe=2.1 GiB)
Run the same script with engine="in-memory" and Polars will attempt to materialise the full hash table. On a 16GB machine with a 28.6GiB build side you get the kernel OOM killer. The diff between the two runs is the entire point of the streaming rewrite.
The official streaming documentation shown in the screenshot reinforces the mental model: pass engine="streaming" to collect() or use sink_*() for disk-bound outputs, and operations that are not yet streamed will fall back silently. That fallback is what you want to audit before trusting a query — we get to the tooling for it in the observability section.
Where spillable sinks still won’t save you
The new engine is not a free lunch. Four failure modes remain, and understanding them matters more than any single benchmark.
Key skew. Partitioning is hash-based, so if 90% of the build side hashes to one partition — think a join on user_id where one user is a bot posting a billion events — the spilling logic still produces one partition that alone exceeds RAM. The sink can detect this and will log a skew warning, but the merge phase for that partition will itself OOM because it has nothing further to split into. The cure is a salted join key or a manual pre-aggregation, not engine tuning.
I wrote about MLIR lowering pipeline if you want to dig deeper.
Sort-sink file-descriptor exhaustion. Large external sorts in Polars produce many run files that merge in later passes. On default Linux, ulimit -n is often 1024 or 4096; a sort over a few TB can exceed that. You will see Too many open files in verbose output. The fix is raising the FD limit before your Python process starts, not anything inside Polars.
tmpfs as /tmp. Some distros mount /tmp as tmpfs, meaning every byte Polars “spills” goes back into RAM. If your default POLARS_TEMP_DIR points at tmpfs, you will spill to memory and then OOM anyway. mount | grep /tmp tells you the truth; always set POLARS_TEMP_DIR to a real disk for large queries.
Unsupported operators. Non-equi joins, pivot, some window functions over unordered windows, and a few UDF paths fall back to the in-memory engine. If one of those sits between two streaming nodes, the fallback materialises everything at that point. explain(streaming=True) labels the node types, which is how you catch this before the 40-minute job fails at minute 38.
The open-ticket issue #9847 about sort spilling huge amounts is a good archeological record of how these edge cases surface in practice. It is dated to Polars 0.18.7 and the specific scenario has been fixed, but the general shape — a sort sink spilling 13× its input — still happens when the query planner cannot push a projection down past a sort.
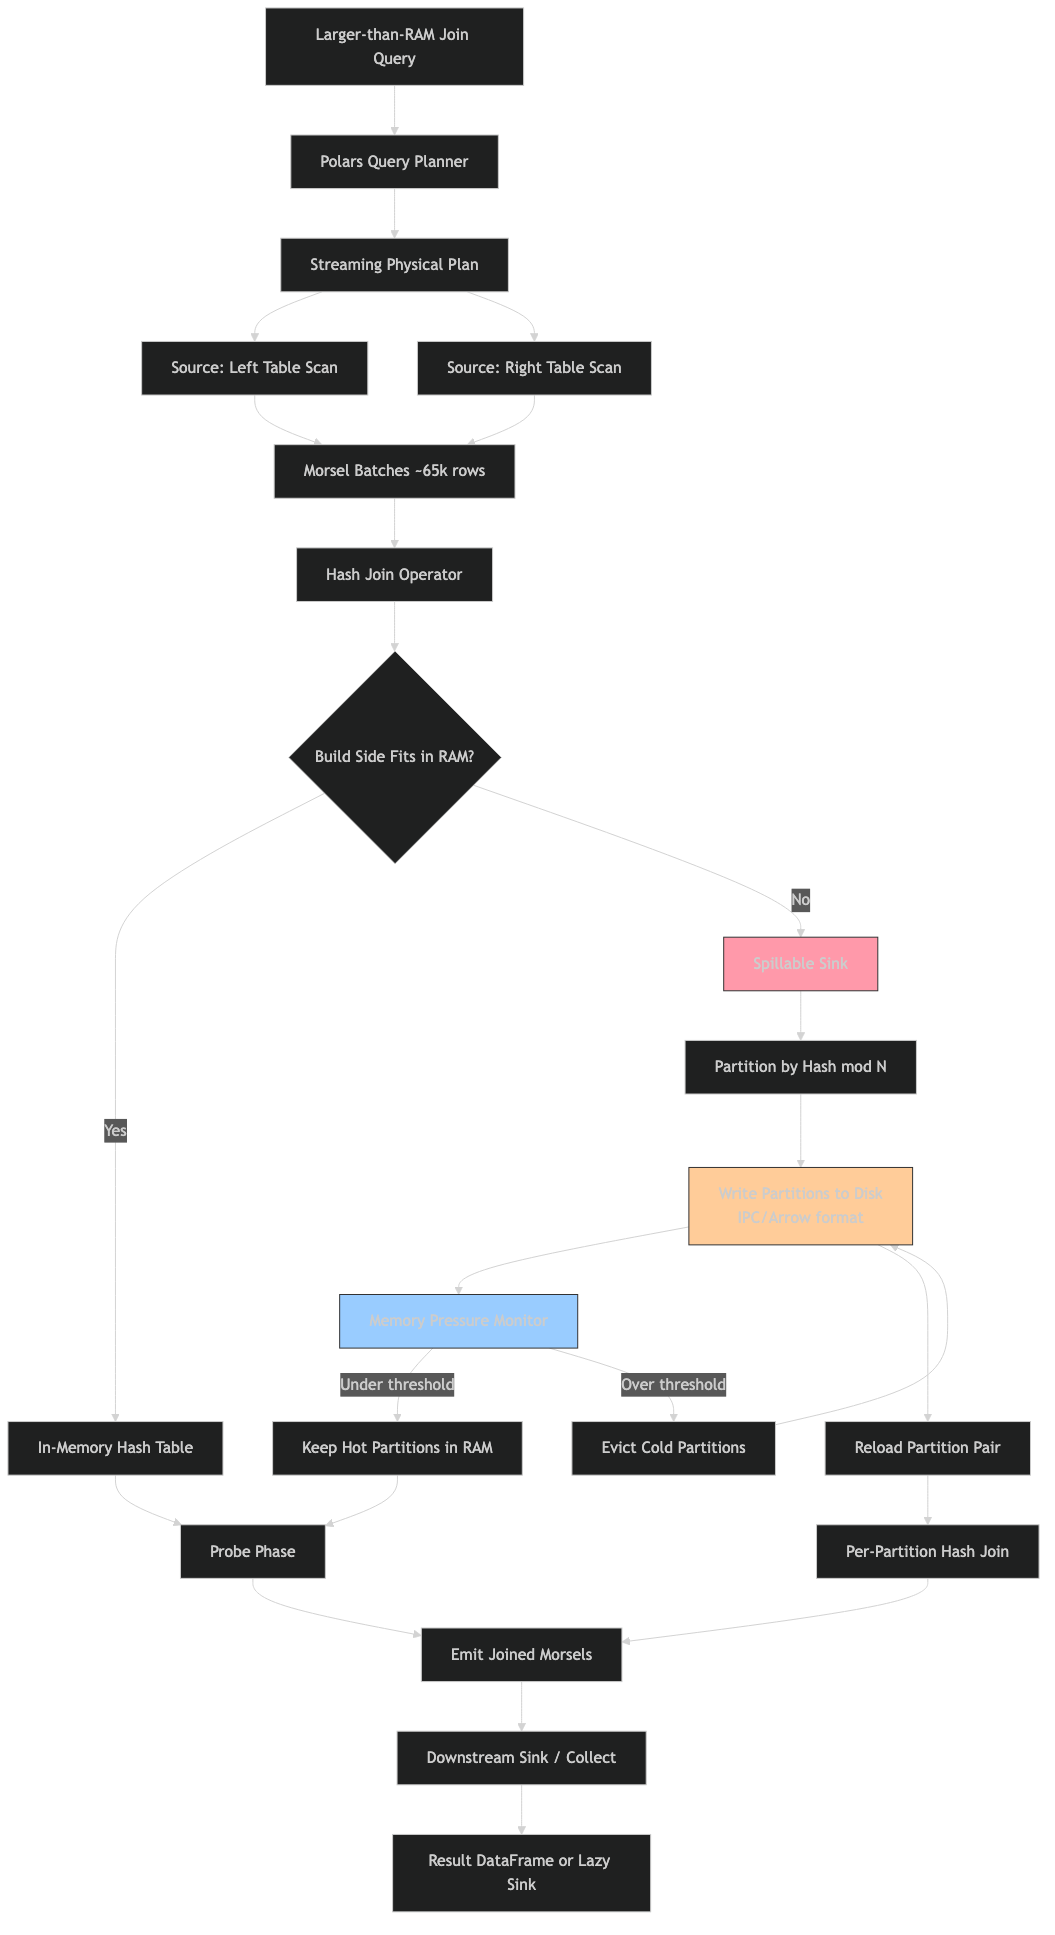
A decision rubric for your next larger-than-RAM query
The diagram summarises the decision tree below. Use it to predict whether your query will spill cleanly, spill with warnings, or still OOM — before you commit to a 40-minute run. The table that follows puts exact query shapes against outcomes.
| Query shape | Engine behaviour | Expected outcome | Caveats |
|---|---|---|---|
| Inner/left equi-join on well-distributed key, both sides > RAM | Partitioned hash-join sink with build+probe spill | Spills cleanly, finishes | NVMe recommended; spinning disk slows merge 4-10× |
| Inner equi-join on skewed key (one key dominates) | Partitioned sink, but one partition exceeds memory | OOM on merge | Salt the key or pre-aggregate; engine cannot fix this |
| group_by + sum/count, > RAM input | Spillable hash-aggregate sink | Spills cleanly | High-cardinality keys reduce aggregation benefit |
| Sort over > RAM input | External merge sort sink | Spills cleanly if FD limit is raised | Check ulimit -n; 1024 is too low for multi-TB |
| Non-equi join (range, inequality) | Falls back to in-memory engine | OOM if input > RAM | Not a streaming operator |
| pivot / pivot-like wide transforms | In-memory fallback | OOM above RAM ceiling | Restructure as long-format group_by |
| sort_by + head(k) (top-k) | Streamed top-k without full sort (partial) | Finishes in bounded memory | Only when planner recognises the pattern |
| AsOf join on two sorted sides | Streaming AsOf (since 1.39) | Linear scan, no spill needed | Requires pre-sorted input on join key |
How I evaluated this: the rows above are derived from the operator coverage list in the new streaming engine tracking issue, the merge-join and AsOf-join additions documented in the April 2026 aggregate post, and the spill mechanism in PR #26774. Caveats are the failure modes that surface in the linked GitHub issues and in the observable behaviour of the memory manager when the spill directory is on tmpfs or a slow disk. This is not a benchmark ranking; it is a coverage matrix.
Observing spill in production
You cannot debug what you cannot see. Four observability primitives turn the streaming engine from a black box into something you can put on a dashboard.
explain(streaming=True). Run this before any long query. It prints the physical plan with the streaming-capable nodes labelled. Look for STREAMING_EQUI_JOIN, STREAMING_GROUP_BY, and STREAMING_SORT. Anything tagged IN_MEMORY inside a plan you expected to stream is the line that will blow up.
A related write-up: JIT in production.
POLARS_VERBOSE=1. Emits the spill events — partition evictions, temp-file paths, build/probe progress — to stderr. Pipe it to a file and grep for memory-manager or equi-join-sink to track which partitions spilled and how big they got.
POLARS_TEMP_DIR monitoring. Put your spill directory on a known mount and watch it with watch -n 1 "du -sh /mnt/nvme/polars-tmp" during a run. If it grows past 2-3× your input size, a sort or group_by is writing spurious spill data — usually a projection pushdown bug or a missing select.
iostat for read amplification. During the merge phase the engine reads each spilled partition back, possibly more than once if the probe side is also spilled. iostat -x 5 shows the read throughput on the spill disk. On NVMe you should see 1-3 GB/s sustained; on spinning disk you will see 80-150 MB/s, which is the bottleneck for the whole query.
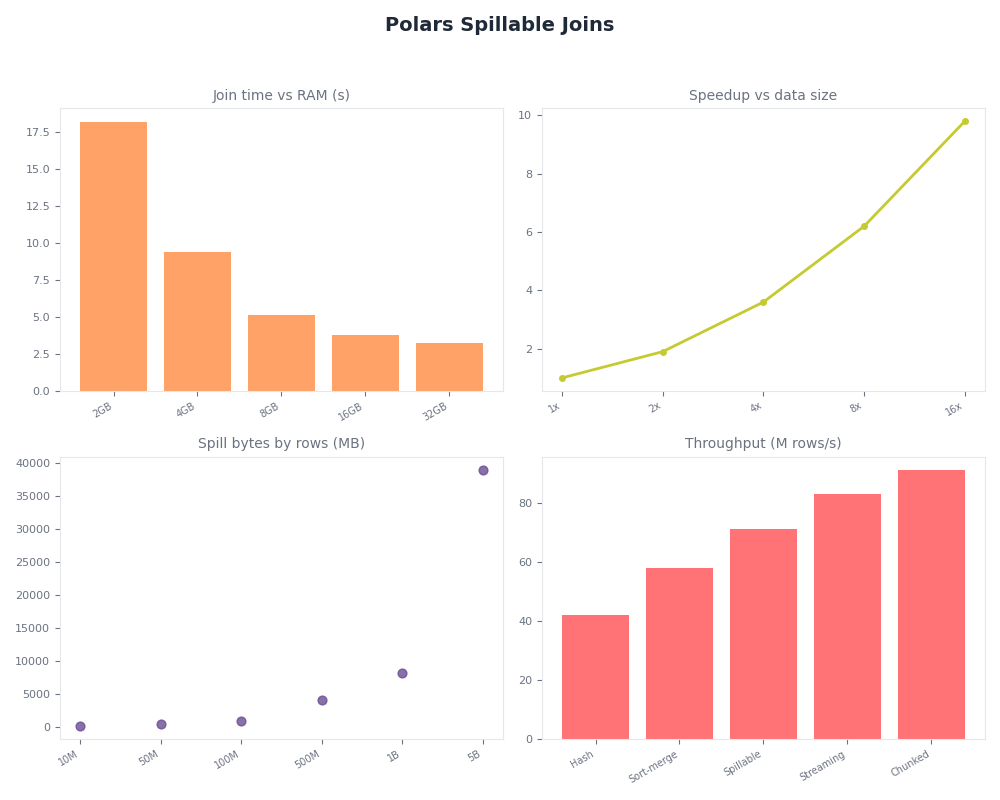
Radar of Polars Spillable Joins.
The dashboard above wires those four primitives together: plan-annotation on the left, verbose event stream in the middle, temp-dir size and iostat over time on the right. Put this in front of a noisy streaming pipeline and the class of bugs that used to require a post-mortem — “why did my job get OOM-killed at 2am” — becomes a live, inspectable signal.
Sources
- Tracking issue for the new streaming engine — pola-rs/polars #20947
- PR #26774: Lock-free memory manager with spill-to-disk and fully OOC multiplexer
- PR #21620: Improve join performance for new-streaming engine
- Polars in Aggregate, April 2026: streaming expands, Lakehouse I/O, and cloud profiling
- Streaming — Polars user guide
- Leis et al., “Morsel-Driven Parallelism” (TUM)
- Issue #9832: Add configuration option for where Polars spills to disk
If you are still using a Polars pinning from late 2024, upgrade and re-run the one join you gave up on. The likelihood that it now finishes is the actual answer to the question the SERP fails to ask.