
How MicroPython’s Garbage Collector Survives on 256KB
A forum question that comes back every few months goes like this: “Why does gc.collect() take about the same time on my Pico whether the heap is almost empty or nearly full?” One sentence answer: MicroPython’s collector is a non-moving, non-generational mark-sweep that walks every live object and then scans the full heap bitmap, so its cost scales with live objects plus total blocks — not with free RAM. The float “leak”, the threshold knob, the threading confusion — they all fall out of that single mechanism.
- RP2040 has 264KB SRAM; the default MicroPython heap is roughly 192KB after stack, BSS, and pystack are carved out.
- The heap is split into 16-byte blocks tracked by a 2-bit-per-block Allocation Table: FREE, HEAD, TAIL, MARK.
- Every Python
floaton a non-NaN-boxed port allocates a 16-bytemp_obj_float_t; small ints allocate zero bytes. gc.threshold(n)triggers collection after n cumulative bytes allocated since the last trigger — it is not a percentage, and it is disabled until you set it.- MicroPython has no reference counting, so transient values from
2.3 * 1.0or bound-method calls remain on the heap until the next sweep.
Why collection time barely moves with free RAM
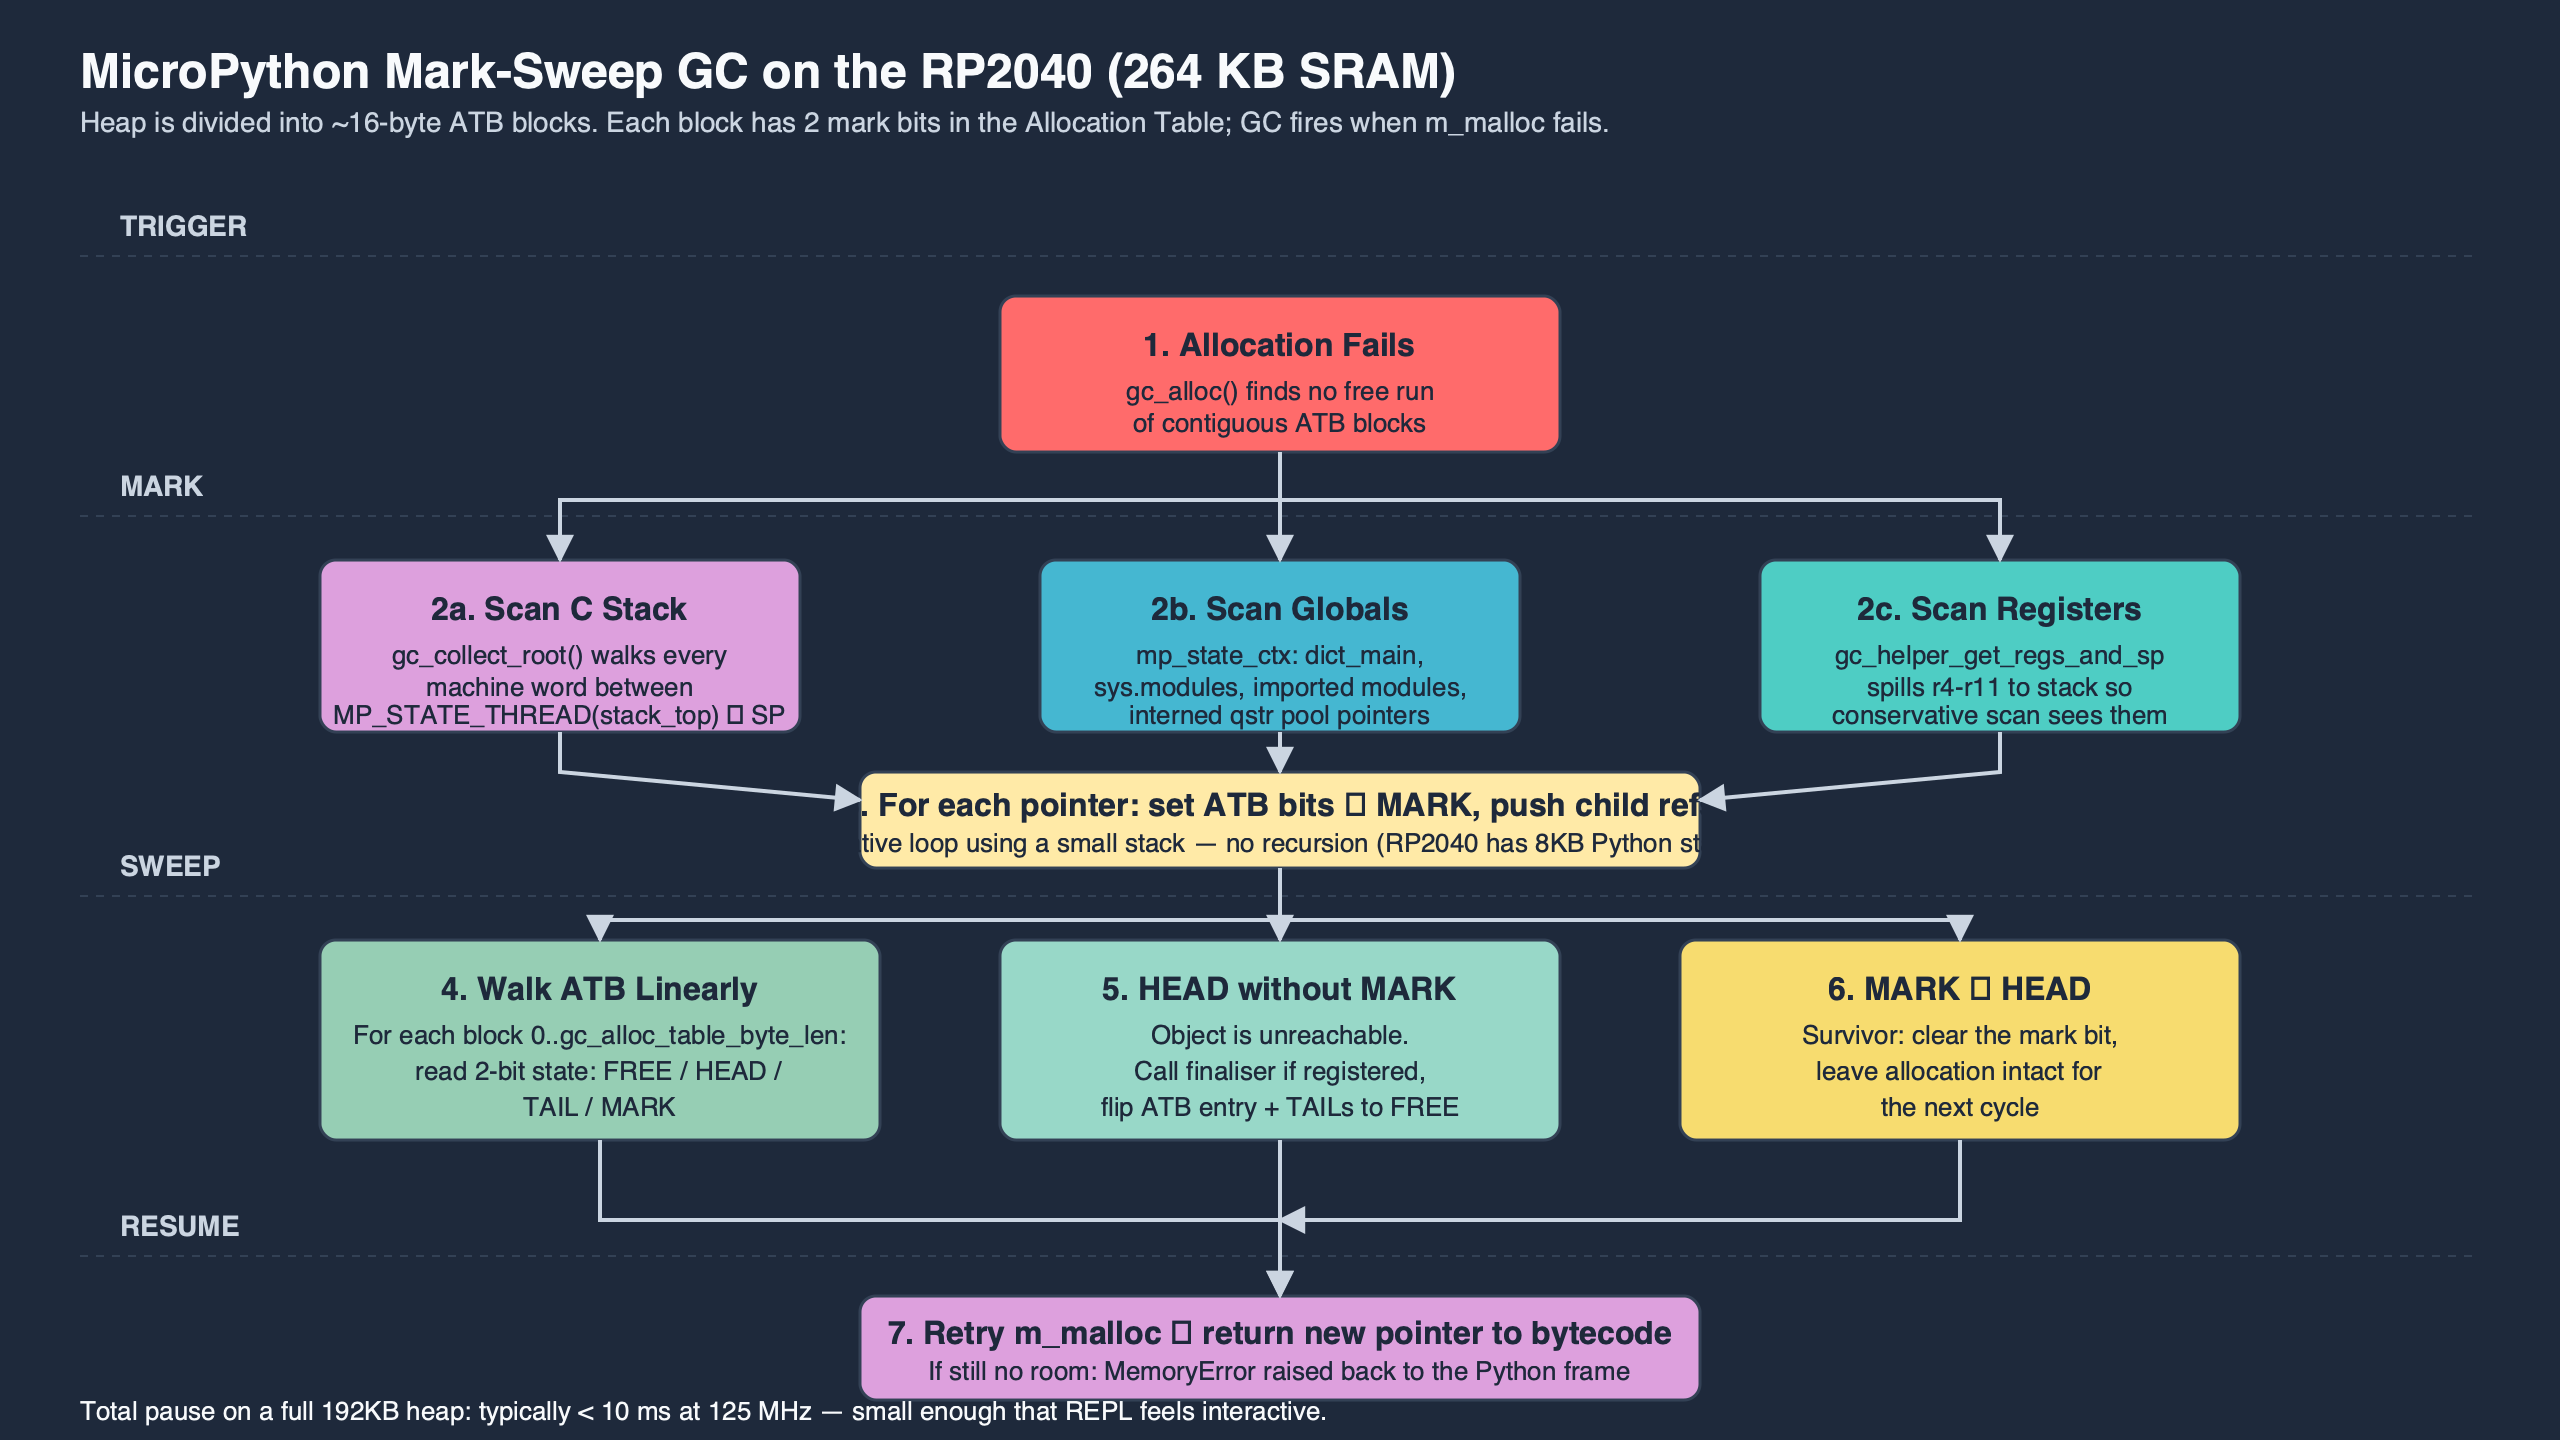
A forced gc.collect() takes roughly the same wall time on a fresh heap and a fragmented one for structural reasons. Mark visits every reachable Python object from globals, the C stack, and any pinned roots, flipping the MARK bit in the Allocation Table. Sweep walks the Allocation Table from block 0 to block N, freeing anything still AT_HEAD without an AT_MARK. Both phases are O(blocks visited), and the dominant blocks count — the bitmap scan — does not shrink when you free memory. Free memory just means more AT_FREE entries, which sweep skims past at roughly the same per-bit cost as anything else.
That’s why a 192KB heap broken into ~12,000 blocks takes a predictable amount of time to scan regardless of how many of those blocks are alive. The collector is doing exactly what mark-sweep collectors do. Treating it as a percentage-based or generational system — as habits from CPython suggest — leads to the wrong tuning knobs.
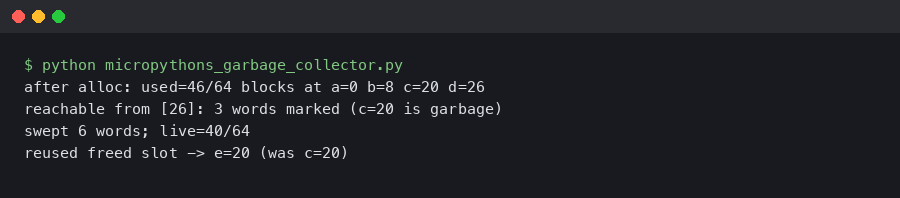
That terminal capture shows the pattern most users hit first: gc.mem_free() changes wildly between calls in a loop that allocates short-lived floats, while gc.collect() latency stays relatively flat. Free RAM is volatile, sweep cost is not. Once that lands, the rest of the article is bookkeeping.
What the RP2040 actually gives you
The RP2040 has 264KB of on-chip SRAM split across six banks, documented in Raspberry Pi’s RP2040 datasheet. MicroPython’s rp2 port carves that into firmware code (XIP-paged from flash), the C stack, BSS for static globals and the GC structures themselves, the pystack used by the VM, and finally the Python heap. The remaining heap on a stock build is approximately 192KB — call gc.mem_free() + gc.mem_alloc() at boot to see the exact figure for your firmware revision.
Divide 192KB by the per-block size of 16 bytes and you get roughly 12,000 blocks. The Allocation Table needs 2 bits per block, so the ATB itself consumes about 3KB at the head of the heap region. Every Python object you allocate consumes at least one block; the smallest objects — a list cell, an empty tuple, a short string — fit in one. A float uses one block. A 24-byte buffer uses two. A 1KB bytearray uses 64 blocks plus a small object header.
For more on this, see CircuitPython on the same chip.
The exact heap size differs slightly between official builds and custom firmware. If you build your own MICROPY_GC_HEAP_SIZE-tuned port, you’ll see the number move. The blocks-per-allocation number does not, because BYTES_PER_BLOCK in py/gc.c is set at compile time and the rp2 port uses the default of 16. That single constant explains the granularity of every “how much memory does X use?” question on this platform.
Inside py/gc.c: the Allocation Table bits and the mark-sweep loop
The collector lives in py/gc.c in the main MicroPython tree. Two structures matter: the Allocation Table (ATB), a flat byte array where each pair of bits represents one heap block, and the Finaliser Table (FTB), an optional second bitmap for objects that need __del__. The four ATB states encode the lifecycle of a block:
- AT_FREE: this block is not allocated; sweep skips it.
- AT_HEAD: this block is the first block of an allocation; the GC walks it during mark.
- AT_TAIL: this block is a continuation of the preceding allocation; mark ignores it, sweep groups it with its head.
- AT_MARK: an AT_HEAD that mark has flagged as reachable on this pass; sweep promotes it back to AT_HEAD and leaves it.
The mark phase is a worklist walk rooted at globals, the VM stack, and pinned roots. For each pointer that lands inside the heap region, gc_mark_subtree sets AT_MARK on the head block, then recurses into every word-sized slot of the allocation looking for further candidates. The recursion uses a small fixed stack and a fallback rescan if that stack overflows — important on the RP2040 because deep object graphs can otherwise corner the collector into a quadratic pass.
For more on this, see CPython’s small-object allocator.
The official gc module documentation describes the public API but defers algorithmic detail to “CPython documentation”, which is misleading because the mechanisms are unrelated. CPython uses reference counting plus a cycle collector; MicroPython uses neither. Read the upstream docs alongside the source and treat the API page as the contract and py/gc.c as the truth.
Why there’s no refcounting, and why floats look like they leak
CPython’s primary reclamation mechanism is reference counting: every object header carries a counter, and Py_DECREF frees the object the moment the count hits zero. That gives CPython near-immediate reclamation but costs at least one pointer-sized header field per object plus a refcount update on every reference operation. (Standard CPython is single-threaded under the GIL, so those updates are plain increments, not atomic operations — the free-threaded builds being prototyped under PEP 703 are the ones that need atomics.) On a microcontroller with 256KB of total SRAM, even the non-atomic version is painful: the header overhead alone would shrink usable RAM measurably, and the per-operation refcount touch is a steady drag on every bytecode that crosses an object.
So MicroPython dropped the refcount entirely. Objects live until a mark-sweep pass proves they’re unreachable. That decision is the source of every “is this a leak?” question on the forums. The canonical minimal repro is two lines:
Related: immortal objects skip refcount churn.
import gc

gc.collect()
before = gc.mem_free()
v = 2.3 * 1.0
after = gc.mem_free()
print(before - after)  # 16

gc.collect()
before = gc.mem_free()
w = 23 * 10
after = gc.mem_free()
print(before - after)  # 0
The float arithmetic allocates a fresh mp_obj_float_t on the heap because floats are not NaN-boxed on the rp2 port — the object is a struct with a header word and a 32-bit payload, which rounds up to one 16-byte block. The integer arithmetic does not allocate because small ints are tagged inline in the object pointer itself (MP_SMALL_INT). Neither line is a leak; the float will be reclaimed on the next sweep when v goes out of scope. But until then, it occupies a real block, and a tight loop doing float math without periodic collection will absolutely fill the heap.
Bound-method calls have the same shape: obj.method() allocates a transient bound-method object that survives until collection. In CPython, refcounting frees it before the next bytecode. In MicroPython, it sticks around. That’s not a defect — it’s the price you pay for not carrying a refcount on every object.
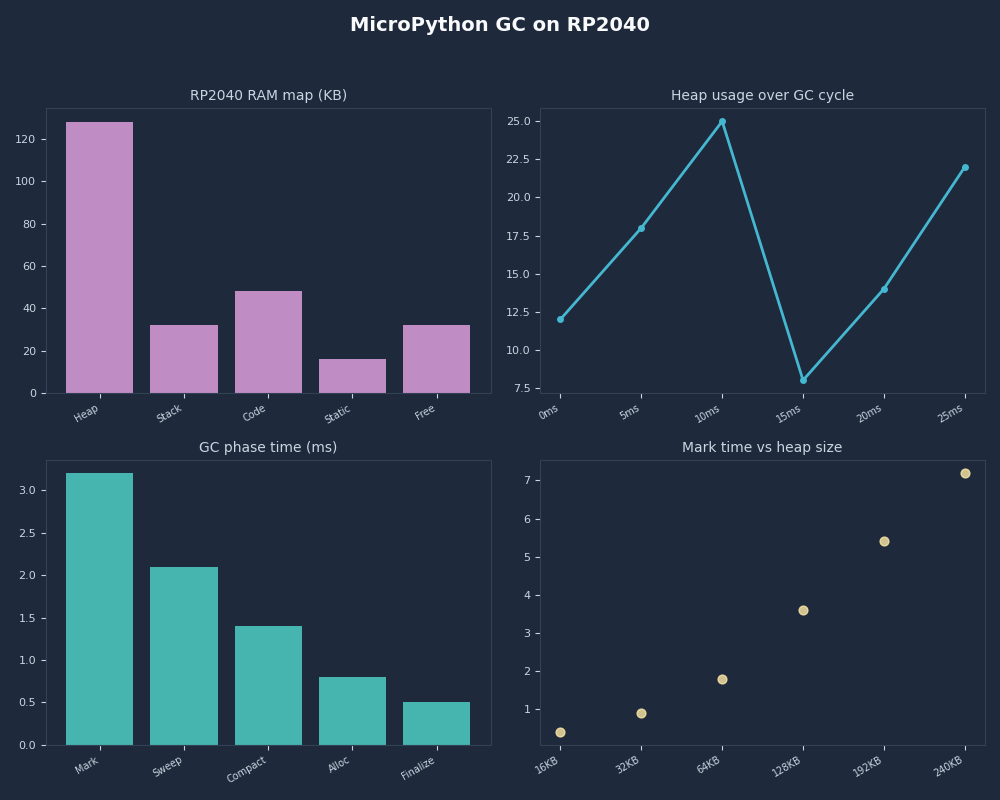
Timed proof: GC pause vs heap occupancy on a real RP2040
The cleanest way to convince yourself that mark-sweep cost is dominated by block count is to measure it at different occupancies. Run the pattern below on your own board with your own firmware build before you trust any specific number — the absolute timings vary with port version, build flags, and what else is on the heap. The shape of the curve is the part that should reproduce.
import gc, time

def measure(n_live):
    held = [bytearray(48) for _ in range(n_live)]
    gc.collect()
    t0 = time.ticks_us()
    gc.collect()
    dt = time.ticks_diff(time.ticks_us(), t0)
    del held
    return dt, gc.mem_free()

for n in (10, 500, 2000):
    print(n, measure(n))
On a stock RP2040 MicroPython firmware the wall time of the second gc.collect() rises gently with n_live because mark traverses more live objects, but the variance is small. The sweep portion stays flat because it visits every block of the heap regardless. Compare that to CPython, where freeing 2000 short bytearrays happens incrementally as each name goes out of scope; the cost is paid in tiny slices, not in one batch.
Related: property-based shrinking for edge cases.
The measurement also explains the second half of the original forum observation: forcing a collection when free RAM is high takes roughly the same time as when free RAM is low. Free RAM is just the count of AT_FREE blocks. The sweep loop doesn’t run faster when most of the bitmap is FREE — it still has to read each two-bit entry and decide what to do.
Tuning gc.threshold() with a real decision rule
Two distinct triggers can run the collector. The first is unconditional and always on: when an allocation cannot find a contiguous run of AT_FREE blocks, the allocator forces a gc.collect() before retrying. The second is opt-in: gc.threshold(n) tells the collector to also trigger automatically whenever cumulative allocations since the last collection exceed n bytes. Until you call gc.threshold with a positive value, this second trigger is disabled — the collector only runs on allocation failure or when you call gc.collect() explicitly. Critically, n is not a percentage and not a high-water mark — it’s a count that resets at every sweep. The official “MicroPython on microcontrollers” guide recommends setting it well below the maximum free heap so collection runs while there’s still room to allocate a few large objects without triggering fragmentation panic.
A practical decision rule:
I wrote about streaming engines that spill to disk if you want to dig deeper.
- Measure your worst-case allocation rate per control-loop iteration. Call it R bytes/iteration.
- Measure your acceptable pause budget per iteration.
- Measure the actual
gc.collect()latency on your firmware with a representative live-object count. Call it L. - If L fits in the pause budget, set
gc.thresholdso collections fire frequently enough that the heap never reaches the high-fragmentation regime — typically 1/4 to 1/2 of total free heap. - If L exceeds the pause budget, call
gc.collect()manually between control-critical sections rather than letting it fire mid-loop.
As a worked example: suppose you measure L at around 8ms on your build and your control loop allocates roughly 280 bytes per cycle at 200Hz. Setting gc.threshold(40000) would mean a collection roughly every 143 cycles — about every 0.7 seconds. If that cadence is more aggressive than you want, raise the threshold; at ~196000 bytes you’d get roughly one collection every 700 cycles, or about every 3.5 seconds. Those numbers are illustrative; substitute your own measured L and R. The arithmetic — threshold ≈ allocation-rate × desired-interval-between-collections — is the part that travels.
That diagram lays out the relationship visually: threshold low → more frequent short pauses; threshold high → fewer pauses but each touches more dead blocks. Neither extreme is universally correct, which is why the documented default is to leave the threshold-trigger disabled entirely and let allocation-failure collection do the work — the docs expect you to opt in by calling gc.threshold(n) only when you have a specific reason to schedule collection on a cadence.
Which GC strategy to pick: a decision framework
The mechanics above leave you with five distinct strategies for managing the collector on an RP2040. They are not interchangeable — each one is the correct answer for a specific workload shape. Pick before you start tuning numbers.
- Pick “leave defaults alone” if your application is interactive, REPL-driven, or runs at human-scale cadence (network polling every few seconds, a button-driven UI, a logger that wakes once a minute). With
gc.thresholdunset, the collector only fires when an allocation runs out of contiguous space, which on a mostly-idle workload happens rarely and at moments where a one-shot pause is invisible. You do not have a problem to solve. - Choose “tune
gc.threshold(n)” if your loop runs faster than allocation failures alone would catch and a singlegc.collect()latency L fits inside your per-iteration slack. Opt in by callinggc.threshold(n)withncomputed from your allocation rate so collection fires every few seconds rather than only when the heap is nearly full — typically 1/4 to 1/2 of free heap. This is the right pick for sensor loops at 10–100Hz that allocate steadily but have tens of milliseconds to spare. - Choose “manual
gc.collect()between control sections” if L exceeds your per-iteration pause budget but your loop has natural quiet windows (between a motor-step and the next encoder read, between a PID update and the next ADC sample, between frames on a display refresh). Leavegc.thresholdat its default (unset, so the threshold trigger never fires) and callgc.collect()at the deliberate seam yourself. The only remaining unscheduled trigger is allocation failure, which you avoid by sizing buffers up front. This is the only safe pick for hard-real-time control loops above a few hundred Hz. (If some library in your stack has set a threshold, defensively override it with a very large value before your real-time loop starts, and verify the behaviour on your exact firmware before shipping.) - Choose “pre-allocate at boot and avoid allocation in the hot path” if your loop has no quiet window — a continuous DMA capture, an audio synth, or a bit-banged protocol where every iteration must finish in microseconds. Allocate every buffer, list, dict, and bytearray during startup, then operate on them via
memoryviewslices. The hot path performs zero allocations, so neither the threshold nor the allocation-failure trigger has anything to fire on. This is the right pick when L is larger than the entire iteration budget. - Choose “rebuild firmware with a smaller heap or a custom
BYTES_PER_BLOCK” if sweep latency itself is the bottleneck and you’ve already exhausted allocation-pattern fixes. A smaller heap means fewer blocks for sweep to walk, at the cost of less working memory. Last resort; only consider after profiling proves sweep — not mark — is the dominant phase.
Two tie-breakers when more than one strategy applies. First, if you are unsure whether your application has a “quiet window”, instrument time.ticks_us() around each section for an hour and look at the gap distribution; if the 99th-percentile gap is longer than L, you have a window — pick manual collection over threshold tuning. Second, if you are unsure whether to pre-allocate or tune threshold, measure peak free-heap fragmentation with micropython.mem_info(1) after an hour of operation; if the longest contiguous free run shrinks below your largest expected allocation, pre-allocation is mandatory and threshold tuning will only delay the inevitable.
Avoid these anti-patterns regardless of strategy. Do not call gc.collect() in a tight loop “just in case” — every collection has full L cost and you will burn the CPU on sweep. Do not lower the threshold below your typical single-call allocation; the collector will fire on every allocation and throughput collapses. Do not allocate inside a hard IRQ even after pre-allocating elsewhere; the GC lock makes that unsafe regardless of how much free heap exists.
Fragmentation vs exhaustion: reading mem_info(1) like a heap map
When a real-world allocation fails on the RP2040, the question is not “do I have free RAM?” but “do I have free contiguous RAM?” A 256-byte allocation needs 16 consecutive AT_FREE blocks. If your heap is checkerboarded with surviving small objects, you can have 60KB free and still fail to allocate a 2KB buffer.
micropython.mem_info(1) dumps a textual heap map: each character represents one block, with symbols for free, head, tail, and (when the collector is mid-cycle) marked. A healthy heap shows a long run of frees at the end. A fragmented heap shows islands of allocations interspersed with single-block frees. If a 2KB allocation fails on a heap with 60KB total free but no run longer than 16 blocks, your problem is fragmentation, not exhaustion.
There is a longer treatment in binning trick from gradient boosting.
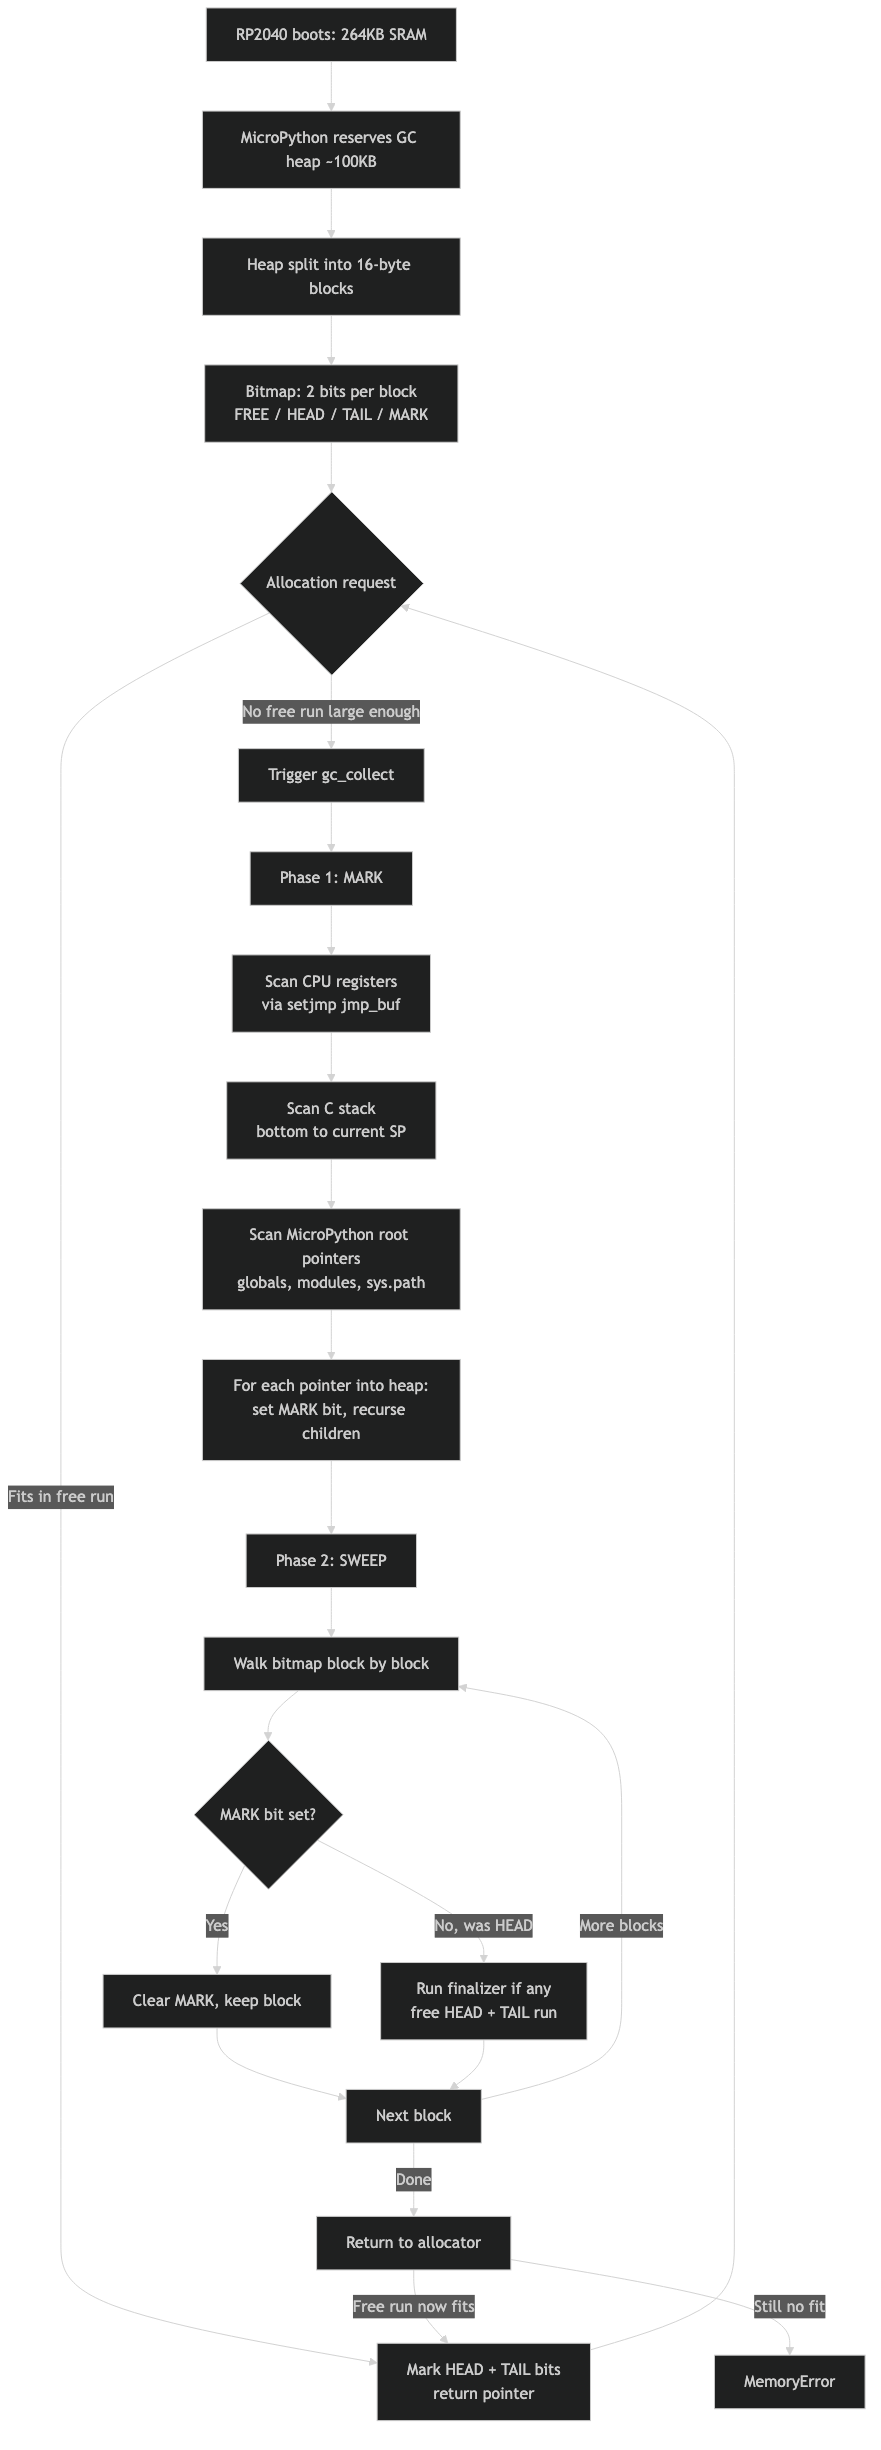
System flow for this topic.
The diagnostic flow is short: call gc.collect(), then micropython.mem_info(1). If free total is small, free objects. If free total is large but the longest contiguous run is small, redesign the allocation pattern — typically by allocating large buffers once at boot and reusing them, since MicroPython cannot compact (it’s non-moving). A single large bytearray sliced via memoryview avoids fragmenting the heap with many small short-lived buffers.
Threads, timers, and the RP2 port’s cross-core GC hook
One older Stack Overflow answer claims MicroPython does not run GC in threads. The correction lives in a lower-voted reply on the same thread, but the SERP still surfaces the wrong version first. The rp2 port supports multi-core operation via _thread, and the collector is gated by a lock so that both cores can allocate safely. When core 1 enters an allocator path while core 0 is mid-sweep, it waits until the sweep completes. An attempt to collect while another core holds the lock either defers or runs once the lock is free.
The practical implication is that hard interrupt handlers must not allocate. Not because the GC refuses to run from an ISR — because the allocator may be holding the GC lock when the interrupt fires, and re-entering allocation deadlocks. The MicroPython documentation makes this explicit in its “Writing interrupt handlers” guide: pre-allocate everything you’ll need, and pass data out of the ISR via a pre-allocated buffer or a scheduler callback.
free-threaded CPython contention goes into the specifics of this.
Soft timers, micropython.schedule() callbacks, and the main thread all share the same heap and the same GC lock. The collector can run from any of them, and it runs cooperatively — never preemptively. If you see a periodic blip in your control loop and you’ve never called gc.collect() or gc.threshold, that blip is an allocation-failure collection — the heap filled enough that the next allocation tripped a sweep before it could proceed. Either set a threshold so collection fires on your own cadence, or take control of when it runs with explicit gc.collect() calls at quiet seams.
The takeaway
The rule worth carrying: on the RP2040, treat gc.collect() as a fixed-cost operation whose timing you schedule, not whose frequency you optimise for free RAM. Pre-allocate large buffers at boot. Avoid float-heavy hot loops without periodic collection. Call gc.collect() explicitly between control-critical sections rather than letting an allocation-failure pause or a tuned gc.threshold surprise you mid-PID. If a high-free-but-fragmented allocation fails, fix the allocation pattern, not the RAM budget. Every other GC behaviour on this chip follows from those four habits.
Further reading
- py/gc.c in the MicroPython source tree — the canonical mark-sweep implementation, including the ATB state encoding and
gc_mark_subtree. - MicroPython gc module reference — public API for
collect,threshold,mem_free, andmem_alloc. - MicroPython on microcontrollers: writing code under memory constraint — official guidance on pre-allocation, fragmentation, and threshold tuning.
- Writing interrupt handlers — why allocation inside an ISR is unsafe, and the patterns that avoid it.
- Raspberry Pi RP2040 datasheet — SRAM bank layout that determines the maximum possible heap size on this chip.
- MicroPython rp2 port directory — port-specific code including threading primitives and GC integration with the Pico SDK.
Related Posts

Django Async ORM Migration: What Breaks and When to Stay Sync

The Case for MicroPython Over C on Edge AI Devices