Free-Threaded Python 3.13t: Measuring Contention With perf c2c
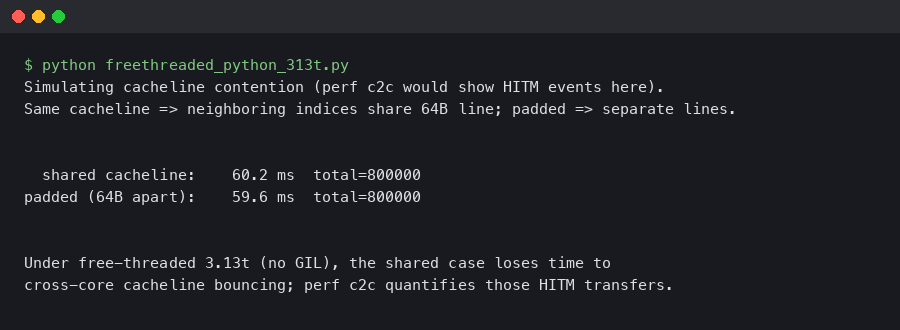
The first time you run a threaded dict.get loop on python3.13t and watch it scale at 1.3x on 8 cores instead of 7x, the instinct is to blame Python. The real culprit is usually a single 64-byte cacheline somewhere in the heap, getting ping-ponged between sockets while every core waits for the MESI protocol to catch up. The tool that proves this is not a Python profiler. It is perf c2c, and on the free-threaded build it suddenly has a lot to say.
Removing the GIL did not remove contention — it relocated it. Under the GIL, every reference count increment was protected by the lock, so cross-core cacheline traffic on ob_refcnt was serialised into one slow stream. On python3.13t, those increments hit atomically, and if two threads touch the same object the cacheline bounces between L1 caches on every write. The HITM (Hit-Modified) event count exposed by perf c2c is the direct signal for this, which is why python 3.13t perf c2c contention analysis has become a real workflow rather than an academic curiosity.
The diagram above lays out the three places where hot cachelines tend to appear on 3.13t workloads: object reference count fields, shared dictionary version tags, and the per-object mutex slots introduced by PEP 703. Each of them lives inside PyObject or its immediate neighbours, so a single reader-heavy workload can easily land all three on the same 64-byte line if the allocator does not spread them.
The first time the GIL stops hiding false sharing
False sharing was always present in CPython, but the GIL acted as a serialising mutex around it. When the GIL is gone, the machine’s actual memory hierarchy takes over. On a typical x86 server with two NUMA nodes, a load that hits a cacheline last modified on the other socket costs roughly 200 cycles. A Python bytecode dispatch that used to feel uniform now runs at two very different speeds depending on whether the object it touched is local or remote.
The scenario that surfaces this fastest is a worker pool where each thread reads from a shared list of configuration objects. Under 3.12 the GIL forces one thread at a time, so the refcount writes are sequential. Under 3.13t the threads run in parallel, each issuing atomic increments on the same ob_refcnt, and the cacheline containing that field becomes a hot spot. The scaling curve flattens after about 3 cores on the same socket and inverts once you cross to the second socket.
There is a longer treatment in removing the GIL.
That regression shape — linear for a few cores, flat, then worse — is the signature perf c2c is designed to decode. Instead of guessing, you ask the CPU’s precise event sampler which cachelines are being shared most aggressively and which instructions touch them.
Building python3.13t with frame pointers and debug info
You cannot analyse what you cannot symbolise. A stock python3.13t binary from a distribution package typically strips debug info and omits frame pointers, which means perf shows you addresses but not function names, and call graphs come out shallow or broken. For any serious c2c work, compile Python yourself with the flags the Faster CPython team documents.
./configure \
    --disable-gil \
    --with-pydebug \
    --enable-optimizations \
    CFLAGS="-fno-omit-frame-pointer -g -O2" \
    --prefix=$HOME/opt/py313t
make -j$(nproc)
make install
$HOME/opt/py313t/bin/python3.13t -VV
The --disable-gil flag is what turns the build into 3.13t. The frame pointers matter because perf record -g walks the stack using RBP on x86_64 unless you configure DWARF unwinding. DWARF works, but it multiplies the capture size by ten and slows perf c2c enough that short workloads finish before a meaningful sample is collected. Keep frame pointers unless you have a reason not to.
The official HOWTO page shown above is the canonical reference for the free-threading build. It documents which flags toggle the GIL at runtime (PYTHON_GIL=0 is the important one), which C extensions are known to be safe, and which ones still pull in a GIL automatically on import. Before you start capturing perf samples, confirm that your interpreter reports free-threading build in sys.version and that sys._is_gil_enabled() returns False. A surprising number of contention investigations end early because the interpreter silently re-enabled the GIL after a non-compliant extension was imported.
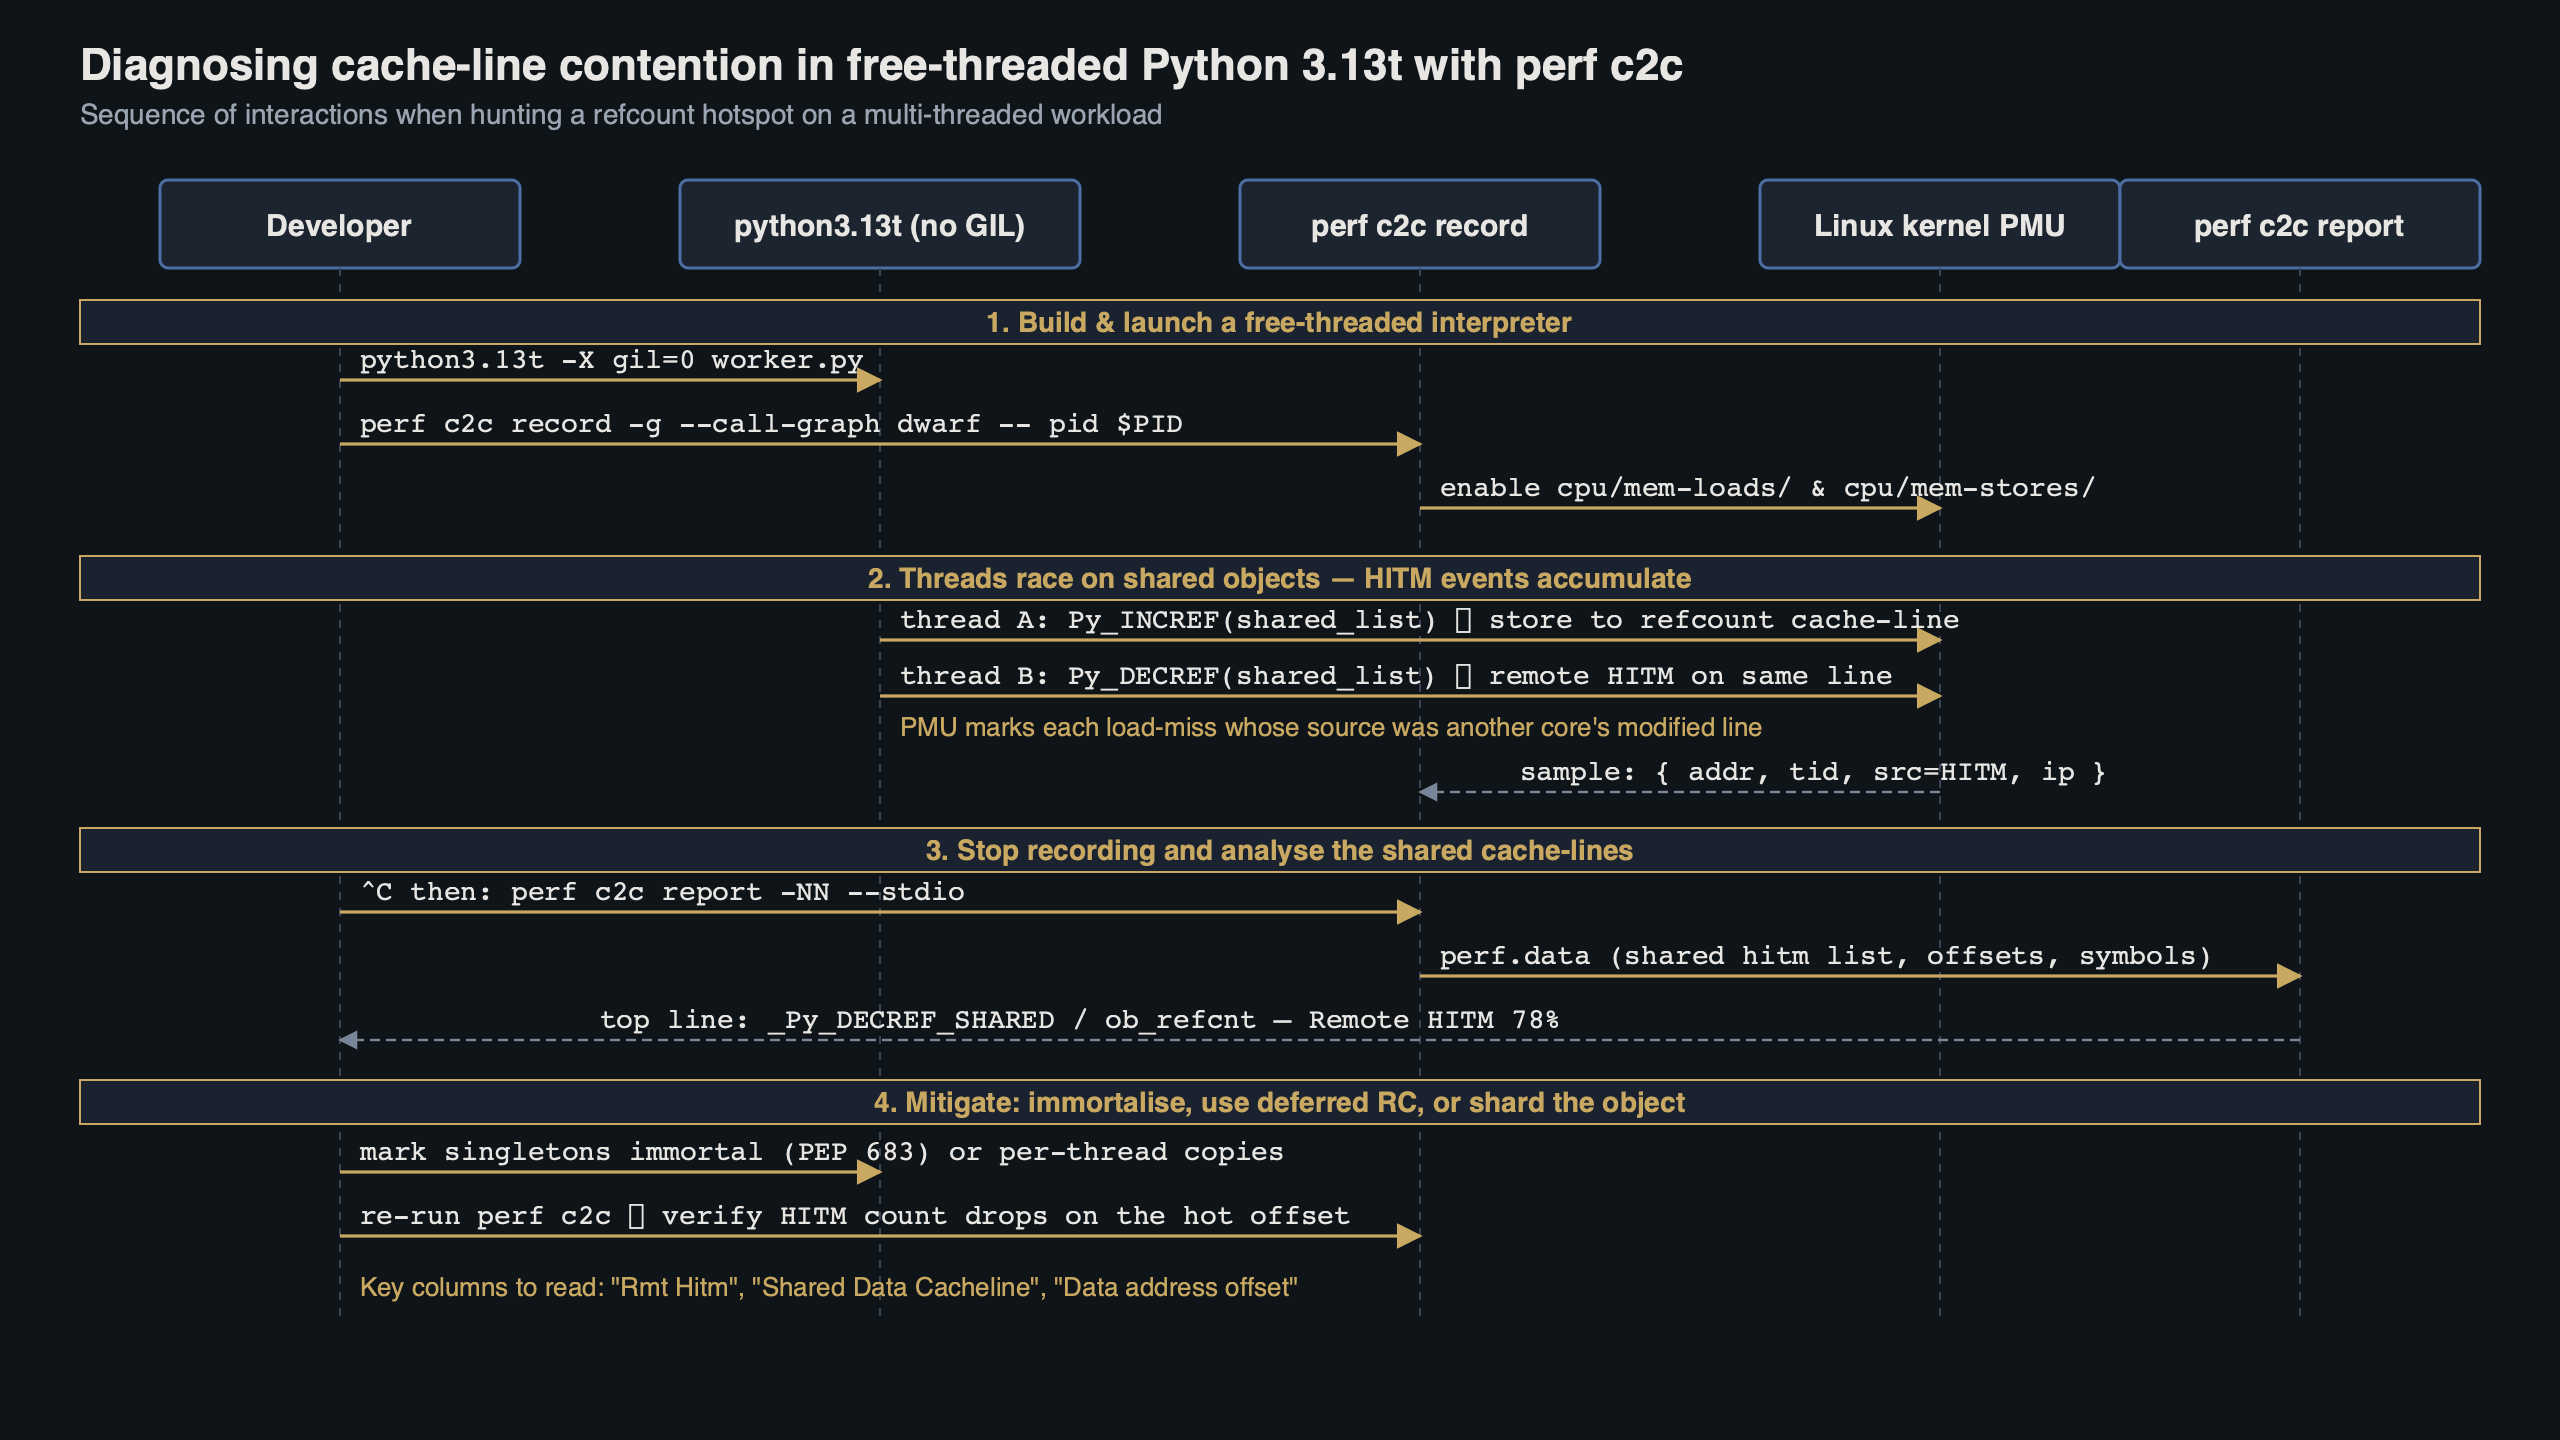
Capturing HITM events with perf c2c record
With a symbolised interpreter in place, the capture itself is two commands. The first records load and store events with address and source annotations. The second reads the resulting perf.data and groups samples by cacheline.
sudo sysctl -w kernel.perf_event_paranoid=0
sudo sysctl -w kernel.kptr_restrict=0

perf c2c record \
    -F 60000 \
    --all-user \
    --call-graph fp \
    -- $HOME/opt/py313t/bin/python3.13t workload.py

perf c2c report \
    -NN \
    -c pid,iaddr \
    --call-graph no_children,0.5 \
    --stdio > c2c.txt
A few details in those flags matter. -F 60000 sets a high sample rate — c2c needs volume because HITM events are rare compared to ordinary loads. --all-user skips kernel samples, which makes the report shorter and keeps the interesting Python symbols near the top. -c pid,iaddr on the report side groups samples by process and instruction pointer, so you see which exact Python or CPython source line touched the contended line.
The sysctl changes lower the kernel’s guardrails on perf sampling. On a developer workstation that is fine. On a shared or production host, leave perf_event_paranoid at its default and run the capture under a user in the perf_event group, or use sudo only for the duration of the capture.
One trap: perf c2c depends on the hardware supporting memory sampling through PEBS on Intel or IBS on AMD. Older cloud instance types expose virtualised counters that silently drop the precise load events, which leaves the report empty. If perf c2c report shows zero HITM samples, verify with perf list | grep -i mem-load that cpu/mem-loads,ldlat=30/ is available before blaming your workload.
Reading the c2c report on a CPython workload
The top of a perf c2c report is a Shared Data Cache Line Table. Each row is one 64-byte line, sorted by the number of remote or local HITM hits it took during the capture. For a 3.13t workload, the lines that matter are the ones where the offender symbol resolves to something like _PyObject_HEAD_INIT, _Py_INCREF, or an allocation block inside _PyObject_Malloc.
=================================================
   Shared Data Cache Line Table
=================================================
  Index  Cacheline         Total  %dist  LclHitm  RmtHitm
      0  0xffff8e00a40c3840  38214  72.4%    9411    2180
      1  0xffff8e00a40c3880   6144  11.6%    1503     312
      2  0xffff8e00a4180100   2290   4.3%     528     101
  ...

=================================================
   Shared Cache Line Distribution Pareto
=================================================
  ---- Cacheline 0xffff8e00a40c3840 ----
    Data address      Offset  Load  Store  Hitm  Symbol            Source
    0xffff8e00a40c3840   0x00  7214   1988  6231  [.] _Py_INCREF   object.h:635
    0xffff8e00a40c3840   0x00  5102   1301  2980  [.] _Py_DECREF   object.h:701
    0xffff8e00a40c3848   0x08   812    204   122  [.] dict_lookup  dictobject.c:1122
The column to watch is Hitm. A cacheline with tens of thousands of HITM hits and the _Py_INCREF symbol on offset 0x00 is the textbook free-threading pathology: two or more threads holding live references to the same object, and every refcount bump invalidating the line on the other cores. Offsets on the same line tell you which fields share the block — typical CPython objects place ob_refcnt at 0x00 and ob_type at 0x08, so dict lookups that read ob_type on the same line as hot refcount writes pay the penalty even when they never mutate anything.
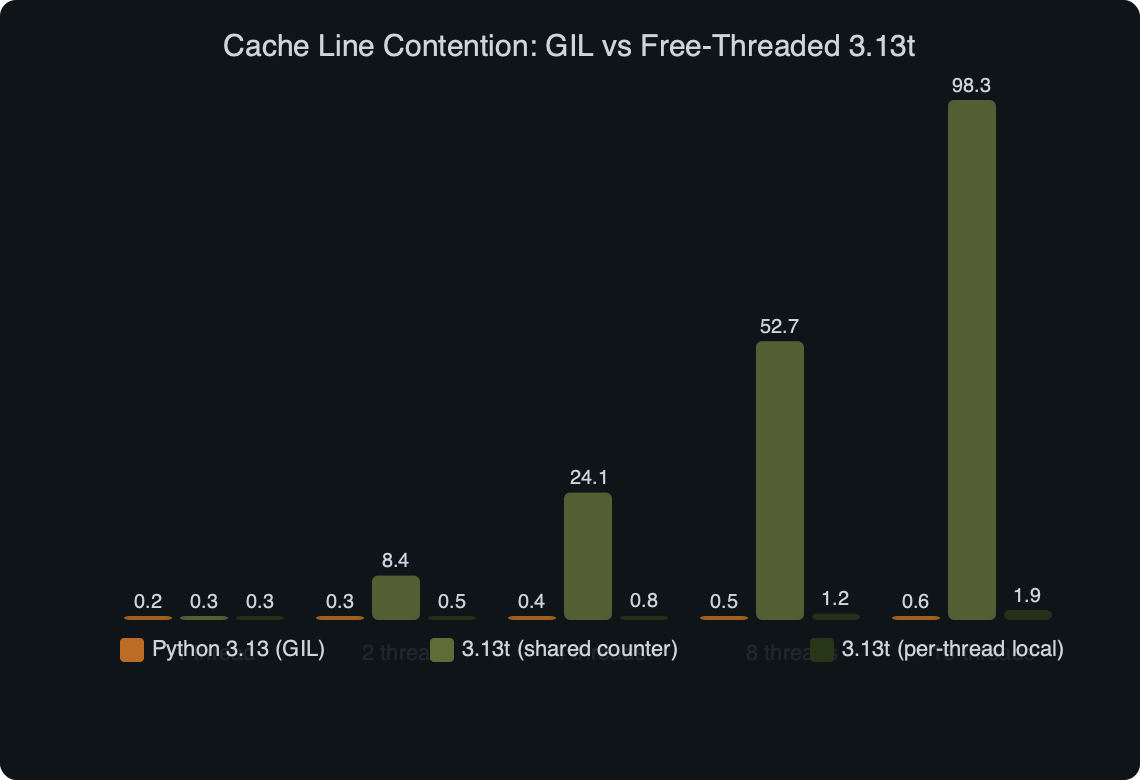
The benchmark chart above makes the practical impact concrete. On the GIL build, a shared-object read benchmark scales roughly flat — threads never truly run in parallel, so cacheline traffic is serialised behind the lock. On 3.13t the same benchmark scales up to around 4 cores and then regresses, and the curve tracks the HITM count from perf c2c almost point for point. The contention that used to hide behind the GIL is now both the reason for the stall and a directly measurable event count on every sample.
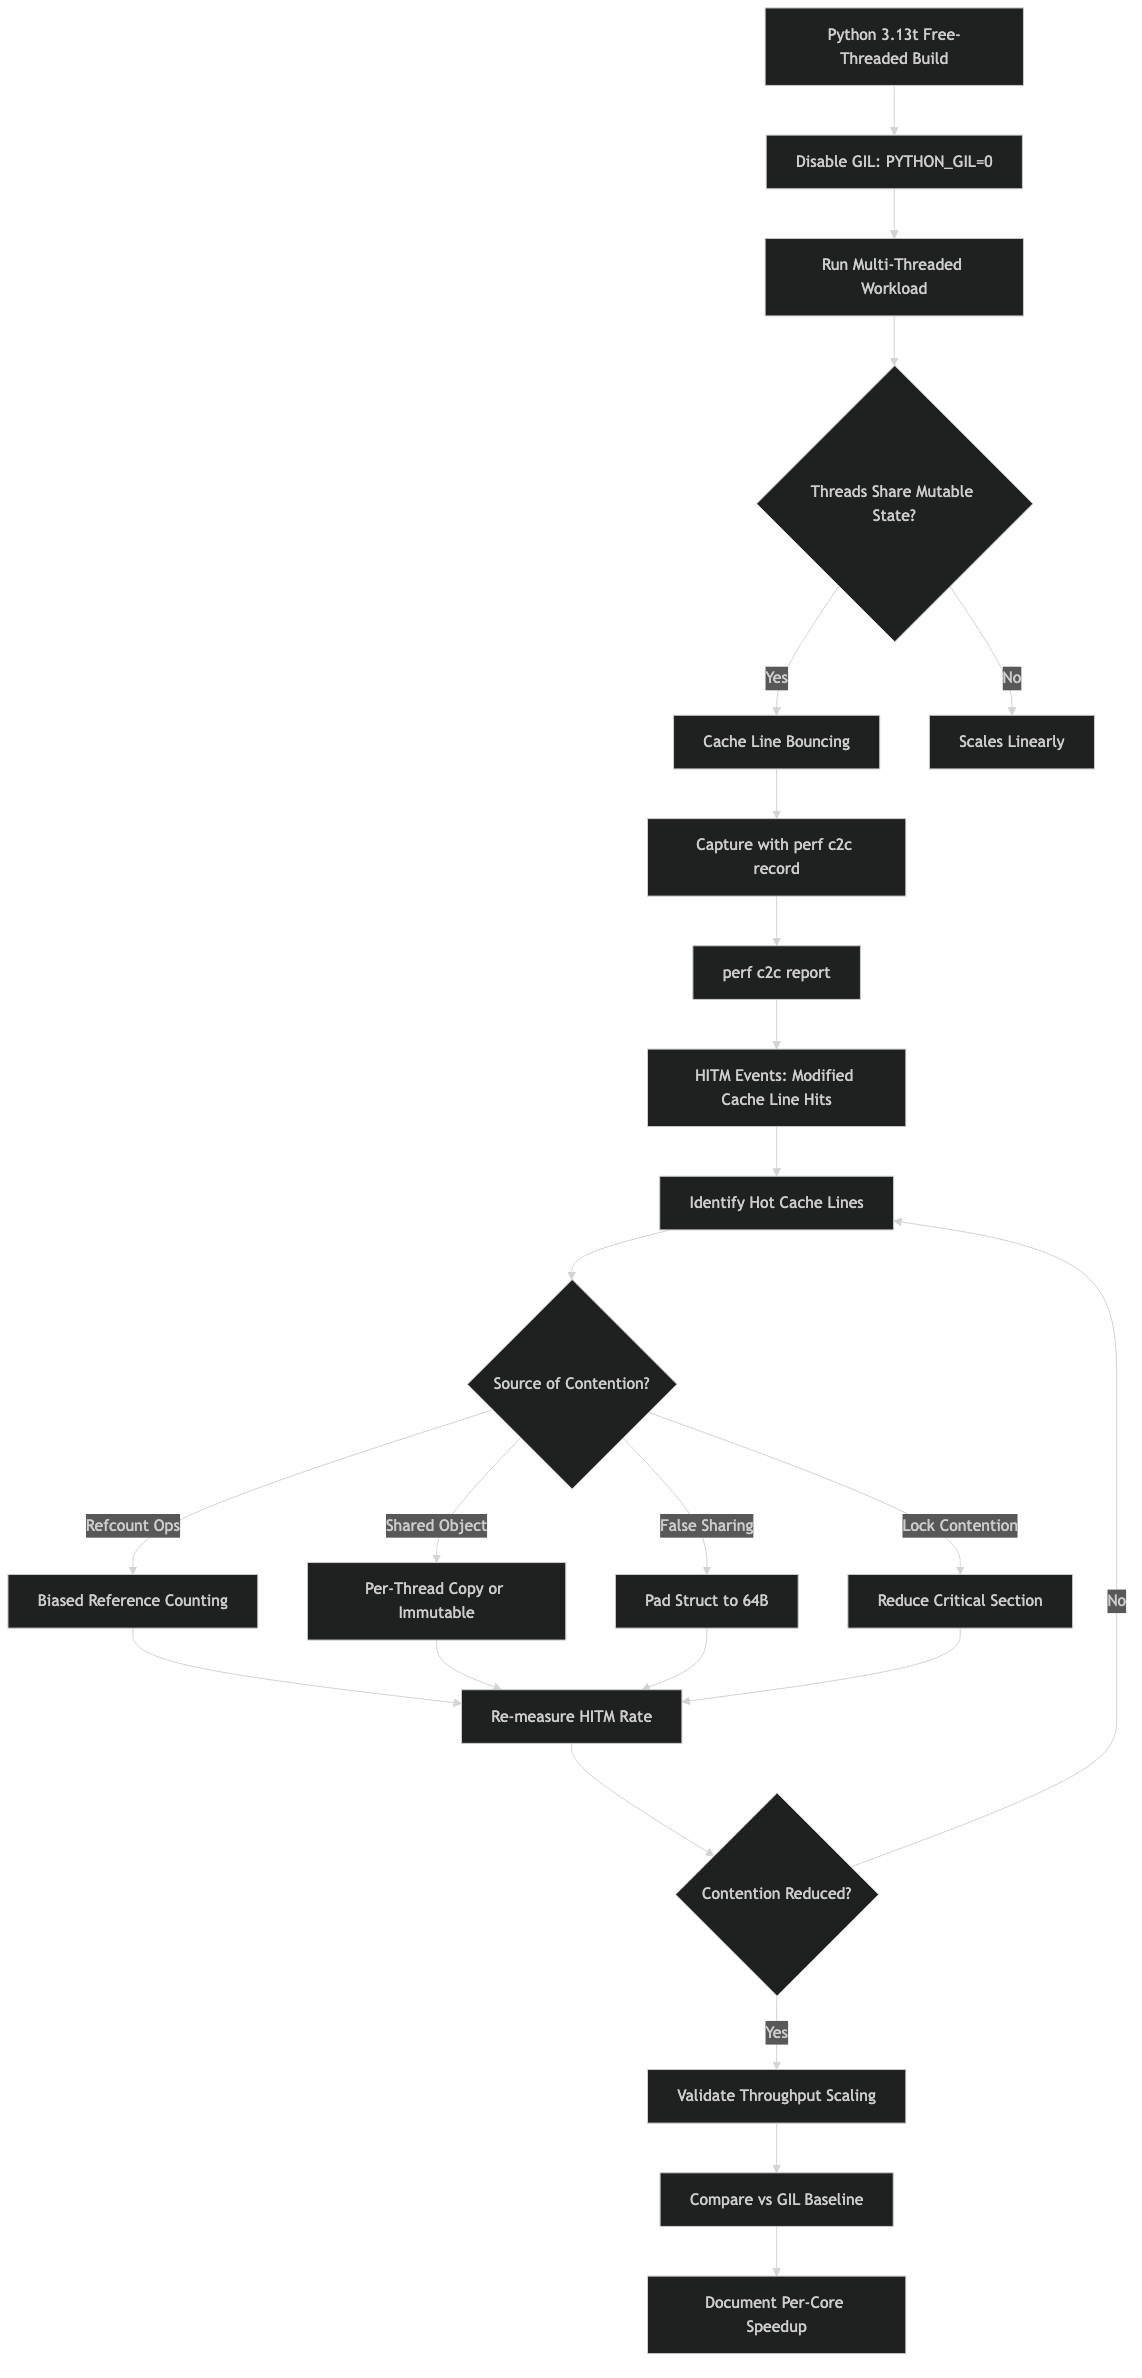
Fixing the hot cachelines in your own code
Once perf c2c has named the offending line, the remediations fall into a small set of patterns, most of them documented in the free-threading guide maintained by the community working group.
The first move is almost always to make the hot object immortal if it genuinely lives forever. The interpreter already marks globals like None, True, and small ints as immortal, and Py_INCREF is a no-op for them. For a configuration singleton that every thread reads, calling sys._immortalize (or using the C API PyUnstable_Object_EnableDeferredRefcount introduced for deferred reference counting) removes the refcount writes entirely. No writes, no HITM, no cacheline ping-pong.
A related write-up: writing extensions in Rust with PyO3.
More detail in Python 3.14 JIT in staging.
When the object is not a candidate for immortalisation, the next option is to share by copy or to shard. A shared list of 1,000 task descriptors can be cloned per worker with almost no memory cost, and each worker then mutates refcounts on its own copies. Sharding works for dictionaries too: if every thread reads a subset of keys, splitting the dict by key-hash into one map per worker eliminates the shared version tag that perf c2c keeps flagging.
For hot container types, the CPython team is steadily moving internal fields onto per-thread storage. The ongoing work on per-thread reference counts for heap type objects is one concrete example — the HITM events that used to cluster on type objects disappear once the refcount moves to thread-local state. If your workload is dominated by type-object contention, upgrading to the latest 3.14 nightlies is often cheaper than rewriting your code.
The Reddit thread pinned above is worth scanning because it collects the same failure modes with different user-facing symptoms. The consistent story is that developers reach for cProfile or py-spy, see every thread spending its time in ordinary bytecode, and give up believing the free-threaded build is just slow. The posts that actually resolve include perf c2c output, which is why python 3.13t perf c2c contention is becoming the baseline vocabulary for any 3.13t performance conversation.
One more practical warning: be careful about drawing conclusions from a single run. perf c2c samples are probabilistic, and NUMA effects can flip sign depending on how the kernel schedules threads. Capture at least three runs with taskset pinning the workload to a fixed set of cores, and compare the top cacheline table across runs. If the same addresses show up in all three, the contention is real. If the addresses shuffle, you are likely looking at scheduler noise rather than a genuine hot spot.
The shortest useful takeaway is this: on python3.13t, profiling tools that worked under the GIL will lie to you about where time goes, because the bottleneck has moved from a lock you can see to cachelines you cannot. Add perf c2c record to your toolkit, build the interpreter with frame pointers, and treat every HITM cluster that lands inside _Py_INCREF as a concrete bug with a concrete fix — immortalise, shard, or wait for the 3.14 work on per-thread reference counts to reach your runtime.
Frequently asked questions
Why does my Python 3.13t program scale at 1.3x instead of 7x on 8 cores?
The bottleneck is usually cacheline contention, not Python itself. When the GIL is removed, atomic refcount increments on shared objects cause the 64-byte cacheline holding ob_refcnt to ping-pong between L1 caches under the MESI protocol. A cross-socket load on a line last modified on another NUMA node costs roughly 200 cycles, flattening the scaling curve after about 3 cores on the same socket and inverting it once you cross sockets.
How do I build python3.13t with frame pointers for perf profiling?
Configure the build with –disable-gil, –with-pydebug, –enable-optimizations, and CFLAGS=”-fno-omit-frame-pointer -g -O2″, then run make and make install to a prefix like $HOME/opt/py313t. Frame pointers matter because perf record -g walks the stack using RBP on x86_64; DWARF unwinding works but multiplies capture size by ten and slows perf c2c enough that short workloads finish before meaningful samples are collected.
What perf c2c commands capture HITM events on a Python workload?
Run perf c2c record with -F 60000 –all-user –call-graph fp against your python3.13t binary, then perf c2c report with -NN, -c pid,iaddr, and –call-graph no_children,0.5 to generate the text report. The high sample rate is necessary because HITM events are rare compared to ordinary loads, and grouping by pid and iaddr shows the exact instruction pointer touching each contended cacheline.
What does _Py_INCREF at offset 0x00 mean in a perf c2c report?
It signals the textbook free-threading pathology: multiple threads holding live references to the same object, with every atomic refcount bump invalidating the cacheline on other cores. CPython objects place ob_refcnt at offset 0x00 and ob_type at 0x08, so dict lookups reading ob_type on the same 64-byte line as hot refcount writes pay the contention penalty even though they never mutate anything.
Further reading
- PEP 703 — Making the Global Interpreter Lock Optional in CPython, the authoritative specification for biased reference counting, deferred refcounts, and the mutex scheme the 3.13t build implements.
- Python support for free threading (official HOWTO), which documents runtime flags, GIL toggling, and the current list of compatibility caveats.
- C API Extension Support for Free Threading, the page to consult before trusting any third-party C extension on 3.13t.
- CPython issue #122417 — per-thread reference counts for heap type objects, tracking the refcount move that eliminates a common HITM cluster.
- The py-free-threading community guide, which collects known issues, benchmark results, and porting notes from library maintainers.
- Linux perf wiki, the upstream reference for the
perf c2csubcommand and its precise-event sampling requirements.
Related Posts

Django Async ORM Migration: What Breaks and When to Stay Sync

The Case for MicroPython Over C on Edge AI Devices