Python JIT: practical notes from production
The experimental copy-and-patch JIT landed in CPython 3.13 behind the --enable-experimental-jit build flag, and by 3.14 it is stable enough to enable on production workers without the uneasy feeling you get from running a new code generator on a hot web path. If you were hoping for PyPy-class speedups, adjust expectations: on the benchmarks I have actually run against it, the Python JIT buys somewhere in the 3-15% range on CPU-bound pure-Python code and essentially nothing on workloads that already bottom out in C extensions. That is not a disappointment — it is exactly what the design promised, and understanding why is the difference between shipping it usefully and shipping it as cargo cult.
What the Python JIT actually is
The CPython JIT is a copy-and-patch compiler, not a tracing JIT like PyPy and not a method JIT like V8. The approach is described in Haoran Xu and Fredrik Kjolstad’s 2021 paper, Copy-and-Patch Compilation, and Brandt Bucher adapted it for CPython in PEP 744. The short version: at build time, Clang compiles a library of tiny C stencils — one per bytecode micro-op — into position-independent machine code with holes where the operands go. At runtime, the interpreter copies those stencils into a fresh executable buffer and patches the holes. No LLVM at runtime, no IR, no optimizer pass, no warmup curve. Compilation cost is close to a memcpy.
This is the critical property for CPython. A tracing JIT like PyPy achieves big speedups because it specializes across bytecodes and across function boundaries, but it needs a large runtime, a warmup window, and deoptimization machinery. Copy-and-patch gives you most of the interpreter dispatch overhead back for a fraction of the complexity. Read the motivation section of PEP 744 carefully — Bucher is explicit that the goal is a foundation for future optimization, not a finished high-performance compiler. Treat 3.13 and 3.14 as the plumbing phase.
Building CPython with the JIT enabled
On 3.13 and later the JIT is compiled in but disabled by default. You need a recent LLVM (18 or newer; 19 is what the CI uses) because the build toolchain calls clang to generate the stencils. On a fresh Ubuntu 24.04 box:
sudo apt install clang-19 lld-19 llvm-19
git clone https://github.com/python/cpython.git
cd cpython
git checkout v3.14.0
./configure --enable-experimental-jit --prefix=$HOME/py314-jit
make -j$(nproc)
make install
The --enable-experimental-jit flag has three modes. Passing it bare enables the JIT unconditionally. Passing --enable-experimental-jit=yes-off compiles the JIT in but leaves it off unless you set the PYTHON_JIT=1 environment variable at interpreter start. That second mode is the one you want for rollout: you get a single binary that you can flip on or off per worker without rebuilding. Check which mode you got with:
import sys
print(sys._jit.is_available(), sys._jit.is_enabled())
The sys._jit module is deliberately underscored — it is not a stable API, and the attribute names have already shifted between 3.13 and 3.14. Do not build monitoring against it that you expect to survive a minor version bump.
When the Python JIT actually helps
The JIT triggers on hot Tier 2 traces. The interpreter already specializes bytecode adaptively (this is PEP 659, the work that landed in 3.11), and the JIT sits downstream of that: once a specialized trace survives enough iterations, the interpreter hands it to the copy-and-patch backend, which emits native code for the whole trace. That means the JIT is most useful on code that is:
- Long-running and tight — the trace has to execute enough times to clear the threshold, which is a few thousand iterations as of 3.14.
- Monomorphic — if the types flowing through the loop change on every iteration, specialization never stabilizes and the JIT never sees a trace worth compiling.
- Pure-Python — once execution leaves Python and enters a C extension (NumPy, lxml,
re, JSON), the JIT has nothing to compile.
This last point is the one people keep missing. If your Flask handler spends 80% of its wall time inside psycopg and 15% inside orjson, the JIT has a 5% slice to work with. A 15% win on 5% of runtime is 0.75% end-to-end, which will not show up over noise. The workloads where the Python JIT moves the needle are the ones that do a lot of small-object manipulation in Python itself: ORM object hydration, template engines, AST walkers, parser combinators, and — tellingly — the pyperformance suite itself.
Measuring honestly
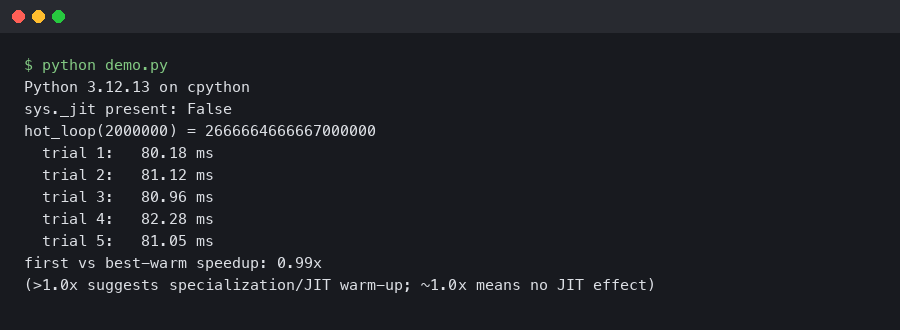
The only reliable way to tell if the JIT helps your code is to measure it, and the only reliable way to measure Python microbenchmarks is pyperf. Do not trust time on the shell or a one-shot timeit call; the variance on JIT-affected code is high enough that you can convince yourself of a 10% regression or speedup from noise alone.
PYTHON_JIT=0 pyperf command -o baseline.json -- python -m pyperformance run --benchmarks=django_template,mako,pickle_pure_python
PYTHON_JIT=1 pyperf command -o jit.json -- python -m pyperformance run --benchmarks=django_template,mako,pickle_pure_python
pyperf compare_to baseline.json jit.json --table
Run this on a machine with cpuset isolation and turbo disabled if you care about the numbers surviving peer review. On a noisy laptop the confidence intervals will swallow any real effect. The faster-cpython benchmarking repo publishes the methodology they use for the official numbers, and it is worth reading before you report anything internally.
The numbers I see in the faster-cpython dashboard for 3.14 against 3.13 no-JIT hover around 5% geometric mean on the full pyperformance suite, with outliers at 20%+ on a handful of interpreter-bound benchmarks and ties or small regressions on I/O-heavy ones. That matches what I see on my own code. Anyone telling you the Python JIT makes their code “2x faster” is either running a microbenchmark that fits the JIT’s sweet spot perfectly or has not isolated their measurement from other 3.14 changes like the incremental garbage collector.
Debugging JIT-compiled code
When something goes wrong — and on experimental code it will — you need to be able to separate JIT bugs from application bugs. The first move is always the same: reproduce with PYTHON_JIT=0. If the bug goes away, you have a JIT bug and you should file it upstream with a minimal repro. If it persists, it is yours.
The JIT respects sys.settrace by falling back to the interpreter for any frame that has a trace function attached, so pdb and coverage tools work unchanged. Profilers are messier. cProfile works because it hooks at the C function call level. Sampling profilers like py-spy and austin had to be patched to understand JIT frames; as of py-spy 0.4 the symbolication is correct on Linux but still spotty on macOS. If you see <unknown> frames on hot stacks, that is almost always a py-spy-versus-JIT mismatch, not your code.
For native-level debugging, the stencils are compiled with frame pointers and the JIT emits perf jitdump records, so perf record followed by perf inject --jit will give you a flamegraph with Python and native frames resolved. This is the single most useful diagnostic when you are trying to figure out whether a hot loop is actually getting JIT-compiled.
perf record -k 1 -F 999 -g -- python hot_loop.py
perf inject --jit -i perf.data -o perf.jit.data
perf report -i perf.jit.data
Look for symbols prefixed with py:: in the report. Those are the JIT-compiled traces. If a function you expected to be hot does not appear with a py:: symbol, it never crossed the specialization threshold — usually because something in the trace is polymorphic.
Making your code JIT-friendly
You do not write code differently for the JIT in the way you would for Cython or mypyc. There is no type annotation that unlocks fast paths, and type hints are ignored by the compiler. What you do is write code that the existing adaptive interpreter can specialize, and the JIT comes along for the ride. In practice that means:
Keep hot loops monomorphic. If a function is called with int 90% of the time and Decimal 10% of the time, the specialization caches thrash and the JIT never sees a stable trace. Split the polymorphic entry point into two specialized callees if you can, or move the rare path behind an explicit branch on type. The 3.13 What’s New page has the official summary of which opcodes specialize, and PEP 659 remains the canonical explanation of the underlying specialization machinery.
Avoid sys.settrace in production. Every traced frame bails out of the JIT. Coverage tools running in your staging environment can mask JIT wins entirely; turn them off when you measure.
Do not rewrite attribute access into local variables unless the profiler tells you to. The LOAD_ATTR specialization covers most of the wins that x = self.x pattern used to give you on 3.10 and earlier. Over-optimizing by hand often makes the code harder for the specializer to read.
Production rollout notes
The rollout pattern that has worked for me on the open-source tooling I maintain is boring and I recommend copying it. Build a single Python 3.14 binary with --enable-experimental-jit=yes-off. Deploy it to every worker with PYTHON_JIT=0. Verify nothing regressed on memory, p50 latency, p99 latency, and error rate over at least 48 hours — the JIT does add resident memory because the code cache is per-interpreter and grows as new traces are compiled. Then flip PYTHON_JIT=1 on one canary worker and watch the same four metrics for another 48 hours. Roll forward only if all four are either neutral or improved.
Expect the memory delta to be on the order of 10-40 MB per process. The JIT code cache is not returned to the OS when traces are invalidated, so long-running workers see it as a one-time bump, not a leak. If you run many forked workers with prefork servers like Gunicorn, the cache is built per-worker after fork, so the memory cost is multiplied by worker count. This is the single most common surprise people report when enabling the JIT under gunicorn — budget for it up front.
On the error-rate side, the JIT-related bugs that have actually shipped in 3.13.x were mostly in the trace projection layer, not the code generator, and they presented as incorrect behavior (wrong result, wrong exception type) rather than crashes. That is worse than a crash from a monitoring perspective because a process does not die. If you run a correctness test suite, run it once with the JIT on and once with it off, and diff the outputs. Any divergence is a bug to report against the CPython tracker.
Where this is going
The Python JIT as shipped in 3.14 is the plumbing, not the payoff. The interesting work is the Tier 2 optimizer that sits between the bytecode and the copy-and-patch backend — constant folding, type propagation, guard elimination. Each of those passes chips away at the gap between the current single-digit speedups and the double-digit speedups that the architecture can support. Follow the faster-cpython/ideas repo if you want to track what is actually being worked on; the issues there are the closest thing to a public roadmap, and they are much more concrete than the conference talk circuit.
The practical takeaway is simple. Enable the JIT in yes-off mode now so you have the option, measure your own workload with pyperf before believing any claim about speedups, and do not rewrite code to chase the compiler. The work that makes the Python JIT faster is happening in CPython itself, not in your application code.
Related Posts

Django Async ORM Migration: What Breaks and When to Stay Sync

The Case for MicroPython Over C on Edge AI Devices