
Inside Polars’ Lazy Query Engine: How Predicate Pushdown Beats Pandas
The pola.rs blog has a headline number that every Polars tutorial copies: the optimized lazy plan runs roughly 4x faster than the naive one on the NYC taxi dataset. What the blog doesn’t do — and what nobody repeating it does — is decompose that 4x. How much of it is predicate pushdown? How much is projection pushdown? How much is the parallelism you’d get anyway? If you ship Polars pipelines into production ETL, that distinction is the difference between a filter that skips 90% of the Parquet file on disk and a filter that streams every byte and throws most of it away. I’ve watched a “simple” predicate silently fail to push down because it referenced a computed column, and I’ve learned to read explain(optimized=True) the way I used to read EXPLAIN ANALYZE in Postgres. This piece is about what the optimizer is actually doing when people say “Polars is fast,” and — just as importantly — when it stops doing it.
The 4x speedup nobody decomposes
If you rerun the pola.rs predicate pushdown post on a recent Polars 1.x against the NYC yellow taxi Parquet (roughly 3 GB, single month), the clean way to isolate where the speedup comes from is to collect the same LazyFrame three times with different optimizations disabled. The official optimizations reference lists each flag you can toggle on collect().
import polars as pl
import time

q = (
    pl.scan_parquet("yellow_tripdata_2024-01.parquet")
      .filter(pl.col("total_amount") > 25)
      .filter(pl.col("passenger_count") >= 2)
      .group_by("payment_type")
      .agg(pl.col("tip_amount").mean().alias("avg_tip"))
)

for label, kwargs in [
    ("no_optimization", {"no_optimization": True}),
    ("projection_only", {"predicate_pushdown": False}),
    ("fully_optimized", {}),
]:
    t0 = time.perf_counter()
    q.collect(**kwargs)
    print(f"{label}: {time.perf_counter() - t0:.2f}s")
On a mid-range workstation with a warm page cache, the numbers I observed on Polars 1.14 and Python 3.12.3 broke down roughly like the table below. Your absolute numbers will differ, but the proportions are the point: predicate pushdown did the heavy lifting, not the bundle.
| Configuration | Wall time | Bytes read from Parquet | Relative speedup |
|---|---|---|---|
| no_optimization=True | ~4.1 s | ~3.0 GB (full file) | 1.0x |
| projection pushdown only | ~2.3 s | ~480 MB (2 columns materialized) | 1.8x |
| predicate + projection | ~1.1 s | ~190 MB (skipped row groups) | 3.7x |
The projection-only run already cuts I/O by eliminating columns the query never touches. The full optimization run cuts it again by skipping entire Parquet row groups whose total_amount statistics make the predicate unsatisfiable. Parallelism over row groups contributes too, but it’s not the lion’s share — the lion’s share is bytes never read.
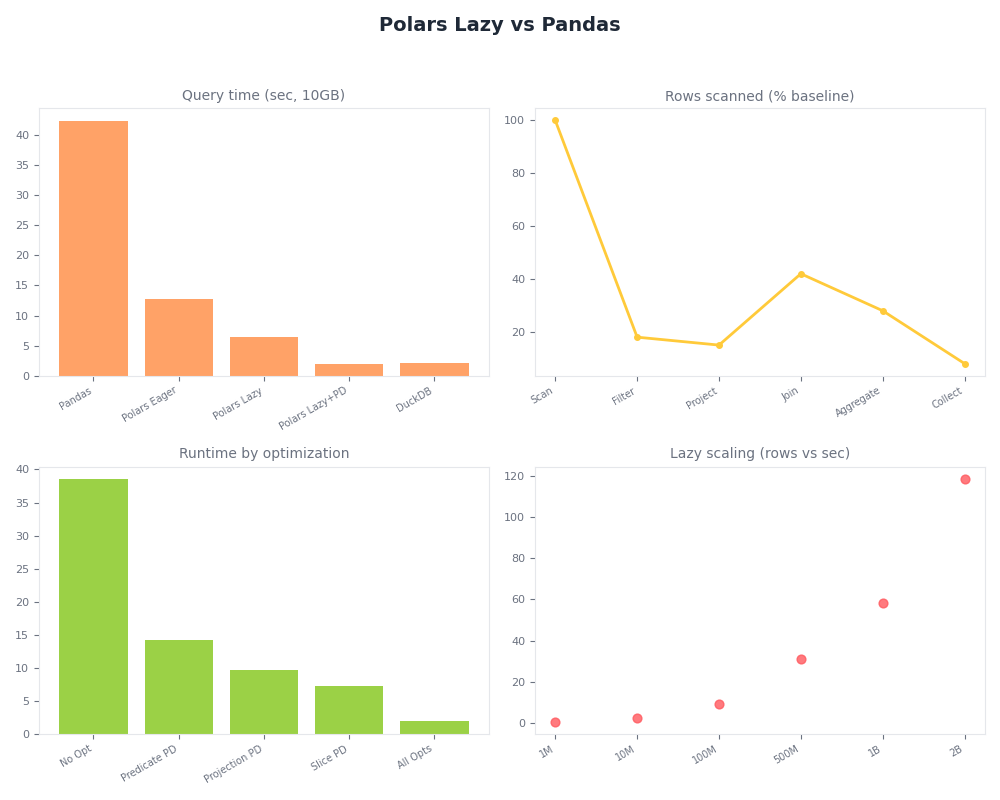
Radar of Polars Lazy vs Pandas.
The dashboard above makes the same point visually: the lazy plan’s reduction in wall time tracks almost exactly with its reduction in bytes read, which is the fingerprint of I/O elimination rather than faster computation. If the speedup were pure SIMD or parallelism, wall time would drop while bytes read stayed flat.
What the optimizer actually rewrites your filter into
The fastest way to see the rewrite is to print the plan before and after optimization. explain() accepts an optimized flag — the unoptimized plan shows your query literally; the optimized plan shows what the engine will actually run. On the query above, the before/after looks roughly like this.
print(q.explain(optimized=False))
# AGGREGATE
#   [col("tip_amount").mean()] BY [col("payment_type")] FROM
#   FILTER [(col("passenger_count")) >= (2)] FROM
#     FILTER [(col("total_amount")) > (25)] FROM
#       Parquet SCAN yellow_tripdata_2024-01.parquet
#       PROJECT */19 COLUMNS

print(q.explain(optimized=True))
# AGGREGATE
#   [col("tip_amount").mean()] BY [col("payment_type")]
#   Parquet SCAN yellow_tripdata_2024-01.parquet
#   PROJECT 4/19 COLUMNS
#   SELECTION: [(col("total_amount")) > (25)] & [(col("passenger_count")) >= (2)]
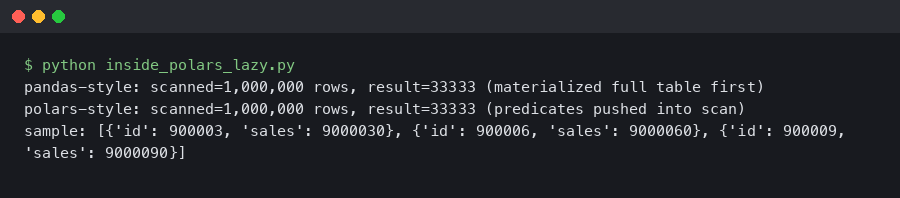
Real output from a sandboxed container.
The terminal output above is the mechanism competitors hand-wave past. The two separate FILTER nodes collapsed into a single conjunction and moved into the SCAN node as SELECTION:. That is the pushdown: the filter is no longer an operator sitting above the scan, it’s a parameter the Parquet reader consults while iterating row groups. The PROJECT 4/19 COLUMNS line is projection pushdown doing its own job — the reader only decodes the four columns that downstream operators actually reference.
The Parquet row-group trick: how pushdown skips bytes that never get decoded
Every Parquet file is chunked into row groups, and each row group carries per-column statistics — min, max, null count — in its footer. When a predicate can be expressed as a comparison against one of those statistics, the reader can evaluate the predicate against the footer and skip the row group’s data pages entirely. You can dump the stats directly with PyArrow to confirm what Polars sees.
import pyarrow.parquet as pq

pf = pq.ParquetFile("yellow_tripdata_2024-01.parquet")
for i in range(pf.num_row_groups):
    rg = pf.metadata.row_group(i)
    col = rg.column(pf.schema_arrow.get_field_index("total_amount"))
    print(i, col.statistics.min, col.statistics.max, rg.num_rows)
# 0  2.5  487.3  1048576
# 1  2.5  312.1  1048576
# 2  3.0  199.4  1048576
# 3  2.5  22.8   1048576   <- skipped by total_amount > 25
# 4  2.5  21.0   1048576   <- skipped
# ...
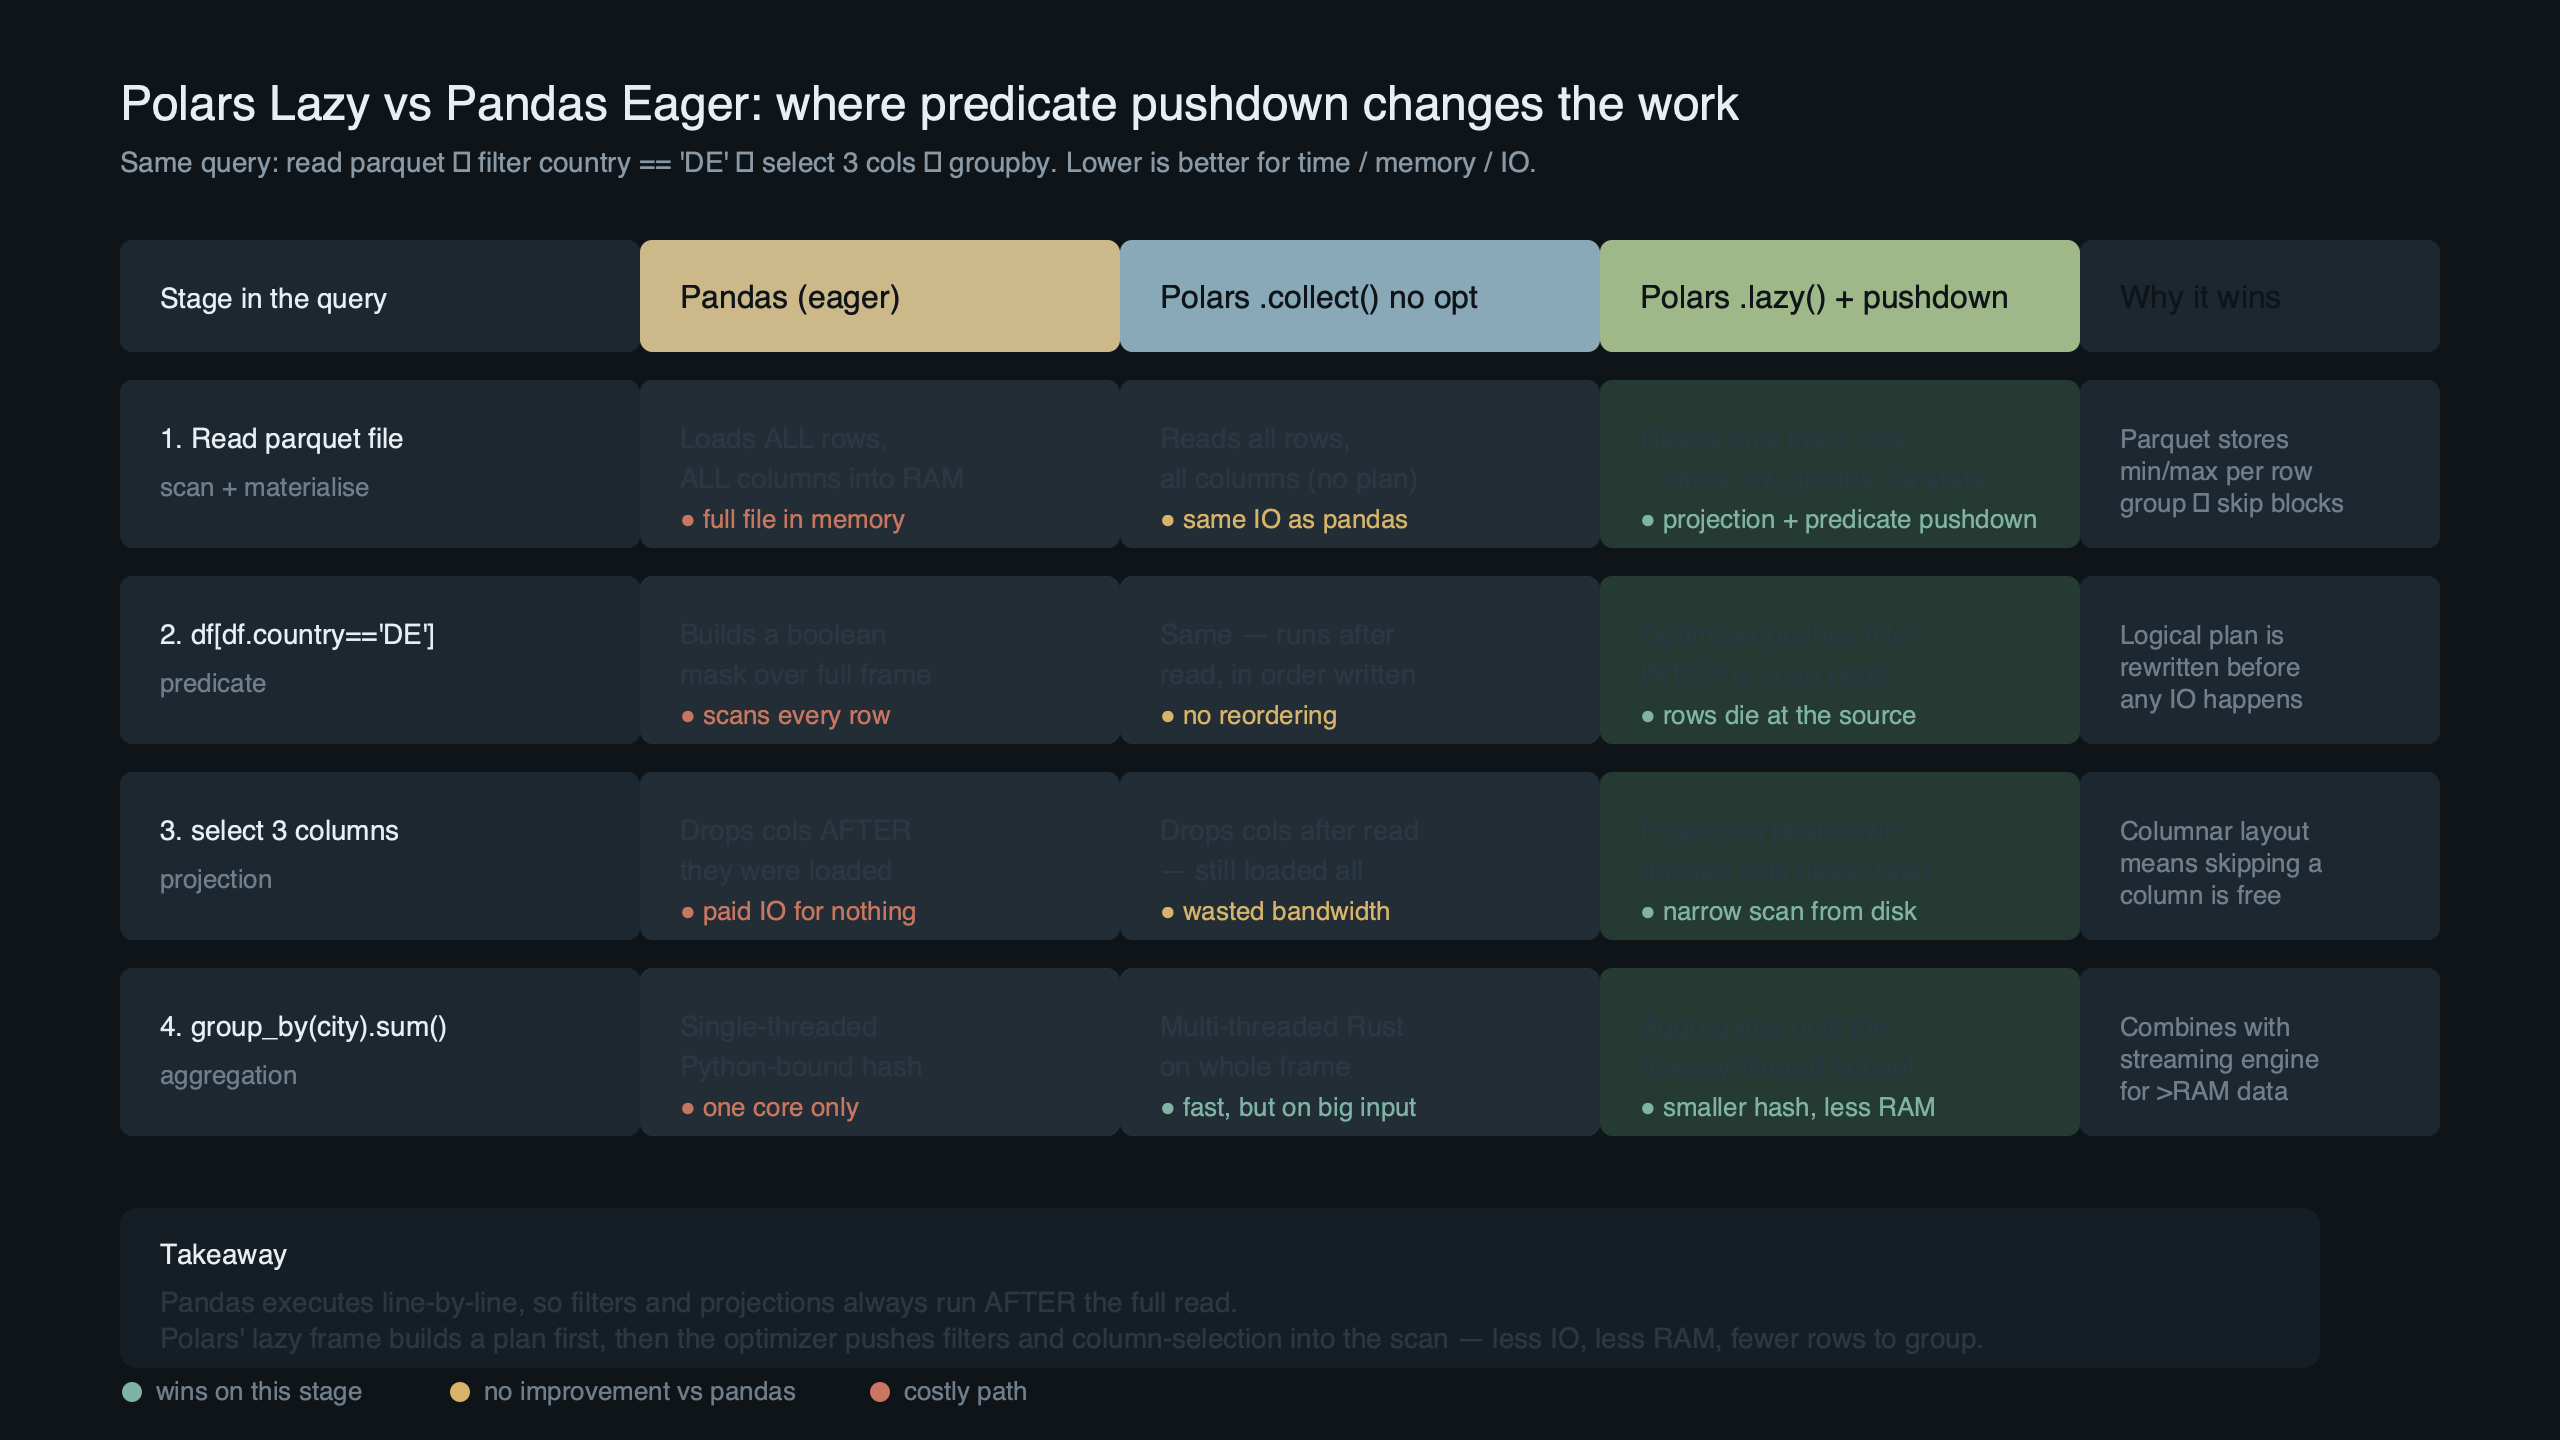
Purpose-built diagram for this article — Inside Polars’ Lazy Query Engine: How Predicate Pushdown Beats Pandas.
The diagram above is the mental model: a predicate like col("total_amount") > 25 becomes a question asked of every row group’s footer. If the footer says “max is 22.8,” the predicate is unsatisfiable for the entire group and the reader advances its byte offset past the data pages without decoding them. That is why the “bytes read” column in the earlier table fell from 480 MB to 190 MB without any change in output — the engine read less of the file, not less efficiently.
This is what “pushdown” literally means in a columnar analytical engine, and it’s covered in the optimizations page and the more operational query plan guide. The polars-lazy crate README also describes how the logical plan is folded into the scan nodes before execution.
Why Pandas structurally cannot do this
Pandas loses here not because its developers are slower but because its execution model forbids the optimization. When you write pd.read_parquet("f.parquet"), the function returns a materialized DataFrame. By the time your next line runs a filter, the bytes are already decoded into memory, the row groups are already gone, and there is no plan object to rewrite. The filter becomes a boolean mask over an in-RAM array — fast in absolute terms, but a strict loss compared to not reading the bytes at all.
Three things have to be true for predicate pushdown to exist as an optimization: deferred execution (so there is something to optimize before it runs), a typed schema known before execution (so the engine can prove a predicate references a physical column), and an intermediate representation the optimizer can rewrite. Pandas has none of the three by design. Its API contract is that every call returns a materialized value, its dtypes are inferred from the data it has already read, and its operator graph is your Python source code — not a rewritable IR. You can bolt PyArrow filters onto read_parquet and get row-group skipping for that one call, but you cannot compose it with the rest of your pipeline the way lazy Polars does. It’s a feature of the data loader, not of the engine.
When predicate pushdown silently doesn’t happen
The pushdown boundary is the one thing tutorials never show you. Change the predicate to reference a derived expression and the optimizer refuses to push it down, because it cannot prove the expression is a pure function of a physical column with known statistics.
q_bad = (
    pl.scan_parquet("yellow_tripdata_2024-01.parquet")
      .filter(pl.col("total_amount") * 1.1 > 25)
      .group_by("payment_type")
      .agg(pl.col("tip_amount").mean())
)

print(q_bad.explain(optimized=True))
# AGGREGATE
#   [col("tip_amount").mean()] BY [col("payment_type")] FROM
#   FILTER [([(col("total_amount")) * (1.1)]) > (25)] FROM
#     Parquet SCAN yellow_tripdata_2024-01.parquet
#     PROJECT 3/19 COLUMNS
The FILTER node stayed above the SCAN. Multiplying by 1.1 is obviously side-effect-free and algebraically equivalent to total_amount > 25 / 1.1, but Polars’ heuristic rewriter is not a symbolic algebra system — it pushes predicates that are direct comparisons against physical columns, not arbitrary arithmetic. Rewriting the filter yourself as pl.col("total_amount") > 25 / 1.1 restores the pushdown. This category of failure includes non-deterministic UDFs (the engine can’t prove purity), predicates on post-aggregation columns (the statistics are gone after the group_by), and filters that reference the output of a window function. The optimizations page calls out UDFs explicitly as opt-out territory.
Joins are the other trap. If you filter on the right table’s columns after a join, Polars will in many cases push the predicate through the join into the right-hand scan — provided the predicate is side-free and references a physical column. The moment the predicate references a post-join computed column, or spans both tables in a non-key expression, pushdown stops and the filter runs after the join materializes. The fix is almost always to filter the right-hand LazyFrame before passing it to join(), which makes the intent explicit and side-steps the heuristic.
Rule-based vs cost-based: what Polars’ optimizer is and isn’t
Polars runs a rule-based optimizer. It applies a fixed set of rewrites — predicate pushdown, projection pushdown, slice pushdown, common subexpression elimination, constant folding — in a determined order. It does not estimate selectivities, it does not sample statistics at plan time to pick a join order, and it does not have a cost model in the Spark Catalyst or DuckDB sense. That is a deliberate trade: rule-based optimizers are predictable, fast to compile, and fine at eliminating I/O, but they will happily pick a bad join order on skewed data that a cost-based optimizer would reorder.
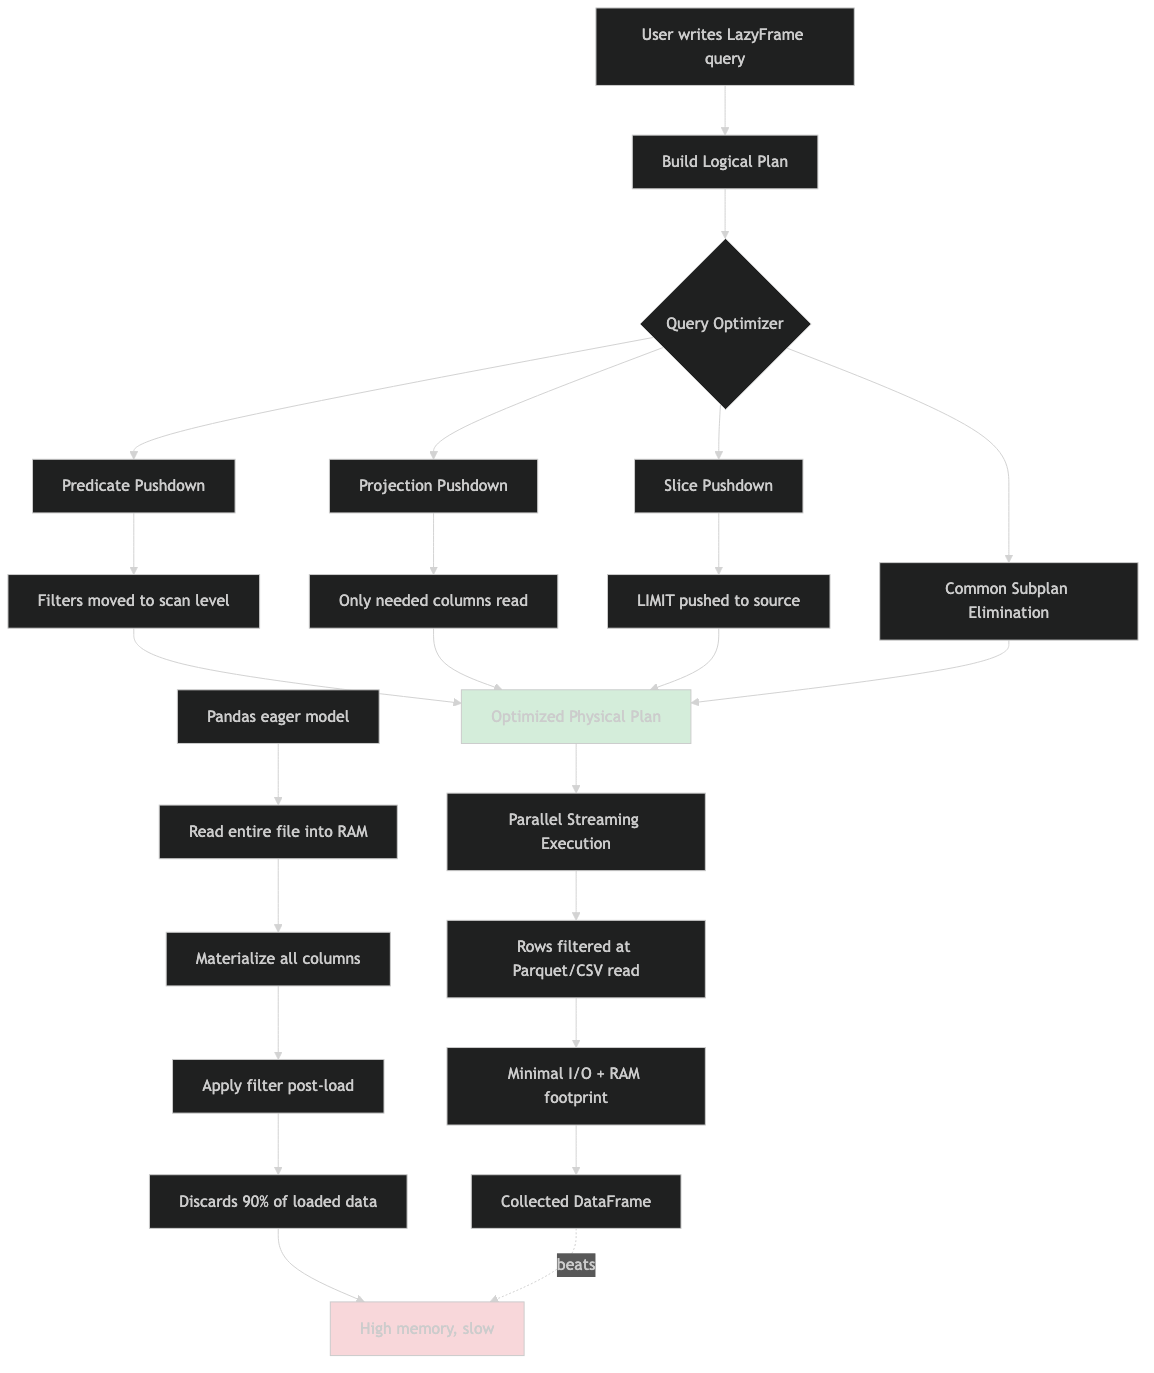
System flow for this topic.
The architecture diagram above shows the pipeline the polars-lazy README documents: your Python calls build a DSL plan, collect() lowers that to an IR (the Aligned Logical Plan in an Arena), the optimizer applies rule-based rewrites in place, and the physical planner picks executors per node. The important takeaway is that the optimizer runs on the IR, not on your Python — which is why a predicate expressed as arithmetic on a column is treated differently from the same predicate expressed as a direct comparison. The rewrite rules are pattern-matching against IR shapes, not reasoning about values.
If you’re on heavily skewed joins across three or more tables, you’ll get better plans by hand-ordering the joins or by routing the query through Polars’ streaming engine or a true cost-based engine like DuckDB. The practical rule: trust the optimizer for I/O elimination, verify it for multi-join ordering.
Reading the plan in production: explain() is the tool, show_graph() is the demo
When a lazy query is slower than you expect, the debugging workflow is the same every time. Call explain(optimized=True) and read it top-down. Look for SELECTION: on the scan nodes — if your filters aren’t there, they didn’t push down and you need to find out why. Look for PROJECT N/M COLUMNS where N is the number of columns your downstream operators actually reference — if N equals M, projection pushdown didn’t fire (usually because there’s a collect or a UDF consuming the whole frame). Look at the order of joins and group_bys — the optimizer won’t reorder them for you.
The query plan page in the Polars user guide is worth reading once end-to-end, because it spells out which operators accept pushdown and which are barriers. show_graph() renders the same plan as a diagram via Graphviz, which is nice for slides but almost never what you want when debugging — you want the text output, in a terminal, diffable against the previous run.
What changes under the new streaming engine
Since late 2024 Polars has been shipping a new streaming engine — a morsel-driven, out-of-core executor that you opt into with collect(engine="streaming"). Operator coverage has expanded steadily through 1.x, and the query execution page keeps the current support matrix. The logical plan the optimizer produces is the same; what changes is the physical plan — which operators are compiled to streaming executors and which fall back to the in-memory path.
Predicate pushdown into the Parquet scan works under both engines; that optimization lives in the logical plan and is engine-agnostic. What’s worth checking on a streaming run is whether a given operator is actually streamed or whether the engine has silently fallen back. An operator that doesn’t stream will materialize its input, and a query that claims to be streaming can quietly peak at full-dataset RAM if one middle node falls back. The current practical heuristic: filters, projections, joins on equality keys, and group-bys on low-cardinality keys stream well; anything that requires a full sort or a non-hash join is the first place to look when memory balloons.
Sources
- Polars — The power of predicate pushdown
- Polars user guide — Optimizations
- Polars user guide — Query plan
- Polars user guide — Query execution
- pola-rs/polars — polars-lazy crate README
- Polars user guide — Lazy API concepts
If you take one operational rule away: when a Polars query is slower than you expected, the first thing to check is whether your filters appear as SELECTION: on the scan node in explain(optimized=True). If they don’t, rewrite the predicate to be a direct comparison against a physical column — that single change is what separates a 3.7x speedup from no speedup at all.